Algorithmic trading thrives on precision, and these ten metrics ensure your strategy is data-driven, not guesswork. Key takeaways:
-
Sharpe Ratio: Measures risk-adjusted returns. Aim for above 1.0; over 2.0 is strong.
-
Profit and Loss (PnL): Tracks ROI. Combine with drawdown and profit factor for context.
-
Win Rate: Percentage of profitable trades. High win rate doesn’t guarantee profitability - pair with risk-reward ratios.
-
Maximum Drawdown (MDD): Shows worst loss. Keep it under 15–20% to manage risk.
-
Profit Factor: Gross profit ÷ gross loss. Look for 1.5+ in backtests; 2.0–3.0 is ideal.
-
Mean Absolute Error (MAE): Evaluates prediction accuracy. Lower values mean better forecasts.
-
Root Mean Squared Error (RMSE): Highlights prediction reliability. Sensitive to outliers.
-
Largest Winning Trade: Tests if strategy relies on one-off wins or consistent gains.
-
Largest Losing Trade: Assesses risk exposure. Compare to average losses for insights.
-
Transaction Volume: Ensures enough trades for reliable data but avoids overfitting to noise.
Each metric offers a unique lens to evaluate performance, risk, and reliability. Regularly monitoring these ensures a balanced, effective trading strategy.

1. Sharpe Ratio
Measuring Risk-Adjusted Returns
The Sharpe Ratio is a key metric for assessing whether trading profits stem from smart decisions or simply taking on too much risk. It calculates the excess return per unit of volatility by subtracting the risk-free rate (often the 10-year U.S. Treasury yield) from portfolio returns, then dividing that figure by the standard deviation of the excess returns [10].
"The Sharpe Ratio helps you determine whether the returns of a strategy are due to good investment decisions or just the result of taking on excessive risk." – Tradetron [2]
Understanding the numbers is crucial. A Sharpe Ratio above 1.0 suggests solid performance, while a ratio over 2.0 is considered very strong. Anything hitting 3.0 or higher is exceptional [10].
This metric serves a dual purpose: evaluating past performance and identifying deviations in real-time.
Tracking Profitability and Losses
You can use the Sharpe Ratio to monitor your strategy's health in real time. A sudden decline might indicate a faltering approach or changing market dynamics. Always calculate the ratio using net returns that account for transaction costs. Ratios that look great in backtests often drop significantly when real-world factors like commissions and slippage are included.
One limitation to note is that the Sharpe Ratio assumes returns follow a normal distribution, which means it may not fully capture extreme market events, often called "tail risk." To make meaningful comparisons between strategies, annualize the Sharpe Ratio for daily returns by multiplying the periodic ratio by the square root of 252 [10].
2. Profit and Loss (PnL) Percentage
Accuracy in Assessing Trading Performance
The PnL percentage is a key metric that shows the actual financial results of your trading system. It’s calculated using the formula: (Total Profits – Total Losses) ÷ Starting Balance × 100 [12][13]. What makes this measure so useful is its ability to standardize performance evaluation, no matter the size of your account.
For example, a $50,000 profit on a $100,000 account translates to a 50% return on investment (ROI). But that same $50,000 profit would only amount to a 5% ROI on a $1,000,000 account [11]. To put things into perspective, successful trading strategies often aim for annual ROIs exceeding 15%, which is well above the S&P 500's 9.9% compound annual growth rate (CAGR) [13][5].
"Total net profit represents the bottom line for a trading system over a specified period of time... however, the metric alone can be deceptive." – Investopedia [4]
Monitoring Profitability and Losses
While the PnL percentage is vital, it’s even more insightful when paired with other metrics. A strategy boasting 40% returns might seem impressive - until you uncover it faced a 45% drawdown along the way [11]. Keep in mind, recovering from a 50% drawdown requires a staggering 100% gain just to break even [13]. This is why combining PnL analysis with metrics like drawdown and profit factor is essential.
Don’t overlook hidden costs like slippage, fees, and commissions, as they can skew backtest results and lead to unrealistic expectations [11][7]. Regularly tracking PnL on a daily, weekly, and monthly basis can help you spot performance shifts early [4][7]. These practices lay the foundation for a deeper dive into evaluating algorithmic trading performance.
3. Win Rate
Understanding Trading Performance Through Win Rate
Win rate measures the percentage of profitable trades made, calculated using this formula: (Winning Trades ÷ Total Trades) × 100 [11]. It provides insight into how effectively your trading algorithm identifies profitable entry and exit points.
But here's the catch: a high win rate doesn't always mean you're making money. For instance, Steve Cohen, the legendary hedge fund manager, revealed that his top trader wins only 63% of the time. Most professional traders operate with win rates between 50% and 55%. Meanwhile, studies show that 70% to 90% of retail traders end up losing money [14].
"Think a 70% win rate guarantees profitability? A 70% win rate does not guarantee profitability. Win rate simply measures the percentage of your trades that end in profit." – TraderLens [14]
Different trading strategies naturally result in varying win rates. For example, mean reversion and scalping strategies often aim for win rates of 60–75% or higher. On the other hand, trend-following systems can thrive with much lower win rates, sometimes as low as 30–40%, because they rely on higher risk-reward ratios to make up for fewer wins. Interestingly, if backtesting shows a win rate above 75–80%, it might signal overfitting - where the algorithm is too narrowly optimized for past data [11]. This underscores why win rate should always be viewed in the larger context of overall trading performance.
Balancing Profitability and Losses
Win rate alone doesn’t tell the full story. Pairing it with metrics like profit factor and risk-reward ratios gives a clearer picture of a strategy’s potential. For instance, professional traders often aim for a risk-reward ratio of 1:3, which means they can remain profitable with win rates as low as 25% [14]. Let’s look at an example:
-
Strategy A: 90% win rate, average gain of $10, average loss of $200 (Profit Factor: 0.45).
-
Strategy B: 40% win rate, average gain of $300, average loss of $100 (Profit Factor: 2.0).
Clearly, Strategy B is far more profitable despite the lower win rate.
To ensure statistical confidence, experts recommend analyzing at least 101 trades for 70% confidence or 666 trades for 99% confidence. A study by the CFTC, which examined over 36,000 retail trading accounts, found that 60% of traders lost money, with median losses ranging from $100 to $200 per session [14]. This highlights the importance of looking beyond win rate and focusing on the bigger picture when evaluating trading strategies.
4. Maximum Drawdown
Risk-Adjusted Return Measurement
Maximum Drawdown (MDD) is a way to measure the steepest decline your trading account experiences, from its peak value to its lowest point, before recovering to a new high. Essentially, it highlights your strategy's worst-case scenario for losses [15][2].
The formula for MDD is straightforward: MDD = [(Peak Value - Trough Value) / Peak Value] × 100 [18]. For instance, if your account reaches $100,000 at its highest and then drops to $70,000 before rebounding, the MDD would be 30%. To put this into perspective, during the 2007-2009 financial crisis, the S&P 500 saw a maximum drawdown exceeding 55% [15]. A 100% drawdown, on the other hand, means your account is completely wiped out [15].
"Maximum drawdown can be seen as a measure of the potential downside risk of a trading strategy. The higher the maximum drawdown, the greater the potential loss an investor or trader could experience." – Tradetron [2]
MDD plays a key role in the Calmar Ratio, which is calculated as Annualized Return ÷ Maximum Drawdown. This ratio helps you assess whether your returns are worth the risk of enduring your strategy's largest potential dip [15]. Unlike standard deviation, which captures all price movements, MDD zeroes in on the most severe loss, offering a sharper lens to evaluate maximum risk [15][1]. These insights are invaluable for managing risk in real time and tweaking strategies as needed. You can also use a trading signal simulator to test these adjustments before going live.
Ability to Monitor Profitability and Losses
Monitoring MDD is just as important as tracking other performance metrics when it comes to building and maintaining a solid trading system. Keeping an eye on your MDD allows you to make informed adjustments in real-time market conditions.
Most traders aim to keep their MDD under 15–20% [19]. If your real-time MDD surpasses 150% of its historical level, it’s a red flag. This could mean your strategy is no longer effective or that market conditions have shifted significantly [16]. In such cases, it’s time to pause and reassess.
"The maximum drawdown metric needs to be in line with the trader's risk tolerance and trading account size." – Investopedia [4]
To keep MDD under control, traders rely on several techniques, such as strict position sizing (e.g., allocating only 1–3% of capital per trade), diversification, and automated stop-loss orders [17][19]. Volatility-based stops are also common, often tied to the Average True Range (ATR). For instance, in calmer markets, stops might be set at 2-3x ATR, while in volatile conditions, they could be tightened to 1x ATR [17]. Ultimately, your MDD should match your capital and risk tolerance. If losses exceed what you can handle, it’s a clear sign that the strategy isn’t sustainable [4].
5. Profit Factor
Accuracy in Assessing Trading Performance
Profit Factor is a straightforward way to measure how efficiently your trading strategy generates profits. The formula is simple:
Profit Factor = Total Gross Profit ÷ Total Gross Loss [20].
For instance, if your trading strategy produces $100,000 in profits and $50,000 in losses, the Profit Factor would be 2.0. This means you’re earning $2 for every $1 lost [20].
This metric can highlight how a high win rate doesn’t always mean a strategy is effective. Take these examples: Strategy A has a 90% win rate but only small gains with significant losses, resulting in a Profit Factor of 0.45. Meanwhile, Strategy B, with just a 40% win rate but larger gains, achieves a Profit Factor of 2.0 [14].
"Profit Factor is the favorite metric of quantitative traders. It's simple, brutal, and doesn't lie." – TraderLens [14]
Professionals typically look for a minimum Profit Factor of 1.5 before considering a strategy for live trading [11]. A Profit Factor below 1.0 means losses exceed profits, while values between 1.75 and 2.0 indicate solid performance [20]. The ideal range for professional-grade strategies is often between 2.0 and 3.0 [11]. However, values exceeding 3.0–4.0 might suggest over-optimization, which can lead to poor performance in live markets [11]. Up next, we’ll examine common benchmarks for this metric.
Ability to Monitor Profitability and Losses
Keeping an eye on your Profit Factor is essential for accounting for real-world trading costs. For example, a backtested Profit Factor of 1.8 might drop to 1.5–1.6 in live trading due to factors like slippage and commissions [11]. This is why many experienced traders avoid strategies with backtested Profit Factors under 1.5.
Analyzing Profit Factor across different timeframes - daily, weekly, or monthly - can also act as an early warning system. It helps identify whether your strategy’s performance is consistent or overly reliant on a few standout trades [20]. Pairing this metric with others, such as Maximum Drawdown and Win Rate, gives a more complete picture of your strategy’s overall health [20]. You can also use a crypto risk assessment calculator to evaluate how these metrics align with your risk tolerance.
6. Mean Absolute Error (MAE)
Understanding Prediction Accuracy in Trading
Profitability metrics like Profit Factor are crucial, but they don't tell the whole story when it comes to algorithmic trading. Accuracy in price prediction plays a key role, and that's where Mean Absolute Error (MAE) steps in. MAE measures how close your algorithm's predictions are to actual market prices by calculating the average of the absolute differences between predicted and actual values [22]. A lower MAE means better prediction accuracy, with a value of 0 representing a perfect forecast [23]. For example, if you're predicting stock prices in U.S. dollars, an MAE of $2.50 means your predictions are off by $2.50 on average.
"The MAE is a widely used measure of forecast accuracy because it is easy to understand and interpret." – Permetrics Documentation [23]
One of the reasons MAE stands out is that, unlike Mean Squared Error (MSE), it doesn’t square the differences between predicted and actual values. This means it treats all errors equally, avoiding the issue of disproportionately penalizing large outliers [22]. This makes MAE a practical tool for assessing prediction accuracy and supporting better risk management.
Linking MAE to Risk and Performance
While metrics like the Sharpe Ratio focus on risk-adjusted returns, MAE provides a clear view of how accurate your forecasts are [23]. Monitoring MAE can help identify prediction errors before they spiral into major losses [7]. By combining MAE with standard deviation, you can better understand how forecast errors impact price movements and overall risk exposure [1]. Testing MAE under different market conditions ensures that your trading strategies are built on consistent, reliable performance rather than chance [6]. This is particularly important for strategies like mean reversion or statistical arbitrage, where success hinges on how closely predicted prices align with actual market behavior [7].
7. Root Mean Squared Error (RMSE)
Accuracy in Assessing Trading Performance
Root Mean Squared Error (RMSE) is a metric used to evaluate how closely a trading model's predictions align with actual market outcomes. Essentially, it calculates the average difference between predicted values and real results by measuring the standard deviation of residuals - the gaps between predictions and reality [24]. For instance, if an RMSE is $4.00, it means the model's average prediction error is $4.00, expressed in the same units as the variable being predicted, such as dollars, pips, or points. This makes RMSE a clear and practical way to assess prediction accuracy [24].
"Low RMSE values indicate that the model fits the data well and has more precise predictions. Conversely, higher values suggest more error and less precise predictions." – Jim Frost, Statistics By Jim [24]
One key aspect of RMSE is its sensitivity to outliers. Because errors are squared before being averaged, larger deviations have a greater impact on the final value. This makes RMSE especially useful for identifying significant prediction errors. The range of RMSE values starts at zero and extends to infinity, with zero representing a perfect prediction - something rarely achieved in live trading [24]. Beyond accuracy, RMSE also serves as a tool to gauge the reliability of a model's expected returns.
Risk-Adjusted Return Measurement
RMSE can provide deeper insight into the reliability of expected returns. When residuals follow a normal distribution, approximately 95% of actual market values are expected to fall within ±2 times the RMSE of the predicted values [24]. For example, if a model predicts a 10% return with an RMSE of 2%, actual returns are likely to range between about 6% and 14%.
However, it's important to avoid over-optimizing for a lower RMSE by adding irrelevant variables. While adding more variables typically reduces RMSE, this can create a false sense of improvement and lead to overfitting. To avoid this, use residual plots alongside RMSE to uncover any hidden systematic biases [24].
8. Largest Winning Trade
Understanding Profitability and Losses
The largest winning trade in your trading sequence represents the highest profit achieved from a single trade. This metric helps determine if your strategy produces steady gains or relies on occasional big wins to remain profitable [12][8]. For instance, during a 5-month backtest of a BTC-USD strategy using the Jesse algorithmic trading framework in April 2024, the largest winning trade amounted to $1,820.69, while the total net profit reached $4,441.42. This single trade accounted for 41% of the total net profit [12][8].
When one trade contributes such a large percentage of your overall profit, it’s worth questioning whether the strategy could still succeed without that outlier. This is a critical way to test the reliability and strength of your trading system [4].
Evaluating Trading Performance
Looking beyond the extremes, comparing the largest win to the average win offers a clearer picture of your strategy’s performance. In the same backtest, the largest win of $1,820.69 was 1.77 times greater than the average win of $1,026.77. A ratio closer to 1.0 suggests more consistent results, while a significantly higher ratio might indicate that your strategy leans on rare, exceptional trades rather than repeatable patterns [12][8].
The largest winning trade also defines the upper limit of historical performance. In this example, the largest win was more than four times the size of the largest losing trade (-$453.39), highlighting the range of potential outcomes. Additionally, winning trades had an average holding time of 332 hours - nearly double the 174 hours for losing trades - showing the advantage of holding onto profitable positions longer [12][8].
To ensure your strategy is robust and not overly dependent on outliers, evaluate this metric alongside the win rate and average trade size. This approach helps refine your strategy for consistent, repeatable results rather than relying on a single standout trade [4][8].
9. Largest Losing Trade
Understanding the Impact of Your Worst Loss
The largest losing trade represents the biggest single loss you’ve encountered in a trade. In the BTC-USD backtest example mentioned earlier, this loss was notably smaller than the largest winning trade - an important signal for assessing risk.
"One outlier can make a system appear significantly more (or less) profitable than it is statistically. The outlier can be removed to allow for a more precise evaluation." - Investopedia [4]
Why does this matter? A single massive loss can distort your overall performance. To truly test your strategy’s strength, consider excluding such outliers. If your system’s success hinges on avoiding that one disastrous trade, it’s a warning sign that your approach may need fine-tuning [4].
Evaluating Loss Patterns for Better Strategy Insights
Beyond identifying risks, it’s crucial to analyze how losses are distributed. Comparing your largest losing trade to your average losing trade can reveal whether your losses are rare but severe or spread more evenly. If the largest loss significantly outweighs the average, your strategy might be vulnerable to extreme market events, which could overwhelm stop-loss mechanisms [25].
"The biggest winner and biggest loser represent the largest profit and loss you've experienced in a single trade. These metrics highlight the potential risk and reward extremes in your trading strategy." - PineConnector [25]
This metric isn’t just theoretical - it’s actionable. Use it to adjust your stop-loss settings to better reflect your risk tolerance. Additionally, employing proper position sizing, such as limiting each trade to 1-2% of your total account, can help safeguard your portfolio from being derailed by a single loss [21].
10. Transaction Volume
Insights into Trade Volume and Execution Quality
Transaction volume - the total number of executed closed trades - plays a critical role in assessing the reliability of performance data. If the number of trades is too low, the results can be skewed by statistical noise, making it difficult to determine whether your strategy has a real edge or if the outcomes are simply due to chance [6]. Most experts suggest a minimum of 50-100 trades before you can confidently rely on backtest results [11]. This metric doesn’t just reflect trade frequency; it also helps gauge the dependability of your profitability indicators.
However, excessively high trade volumes can be a red flag. A large number of daily trades might indicate that your strategy is overfitting to market noise rather than identifying genuine trading opportunities [6]. As Moore Tech LLC puts it:
"Too few trades = noisy estimates; too many may over-fit microstructure noise" [6].
Another issue with high transaction volume is its impact on execution quality. For automated systems, execution speeds below 100ms are ideal, while delays over 750ms can significantly hurt performance [26]. This is particularly problematic for high-frequency strategies, where even millisecond delays can lead to slippage, reduced order priority, and diminished profitability [26].
Monitoring Profitability and Costs
Transaction volume is also essential for calculating expectancy, which measures the average profit or loss per trade. This is determined by dividing total net profit by the number of trades, giving a clear picture of whether your strategy’s edge is strong enough to cover transaction costs [4][2]. For example, in one backtest, a $10,000 account with only eight trades over five months racked up $426.39 in fees - showing how costs can add up even with low trading activity [12].
"High turnover rates can lead to increased transaction costs, which can erode profits." - uTrade Algos [3]
Striking the right balance is key. Scalping strategies, which rely on high trade volumes, generally require win rates above 50% because individual profits are small. On the other hand, low-frequency trend-following strategies can succeed with win rates as low as 40%, provided that their occasional winners are significantly larger [4][11]. Keeping an eye on turnover rates to manage fees and incorporating realistic assumptions for slippage and commissions are essential steps when evaluating a strategy’s performance [3][6].
Critical Performance Metrics For Algo Trading - Really?!?
How StockioAI Helps Track These Metrics
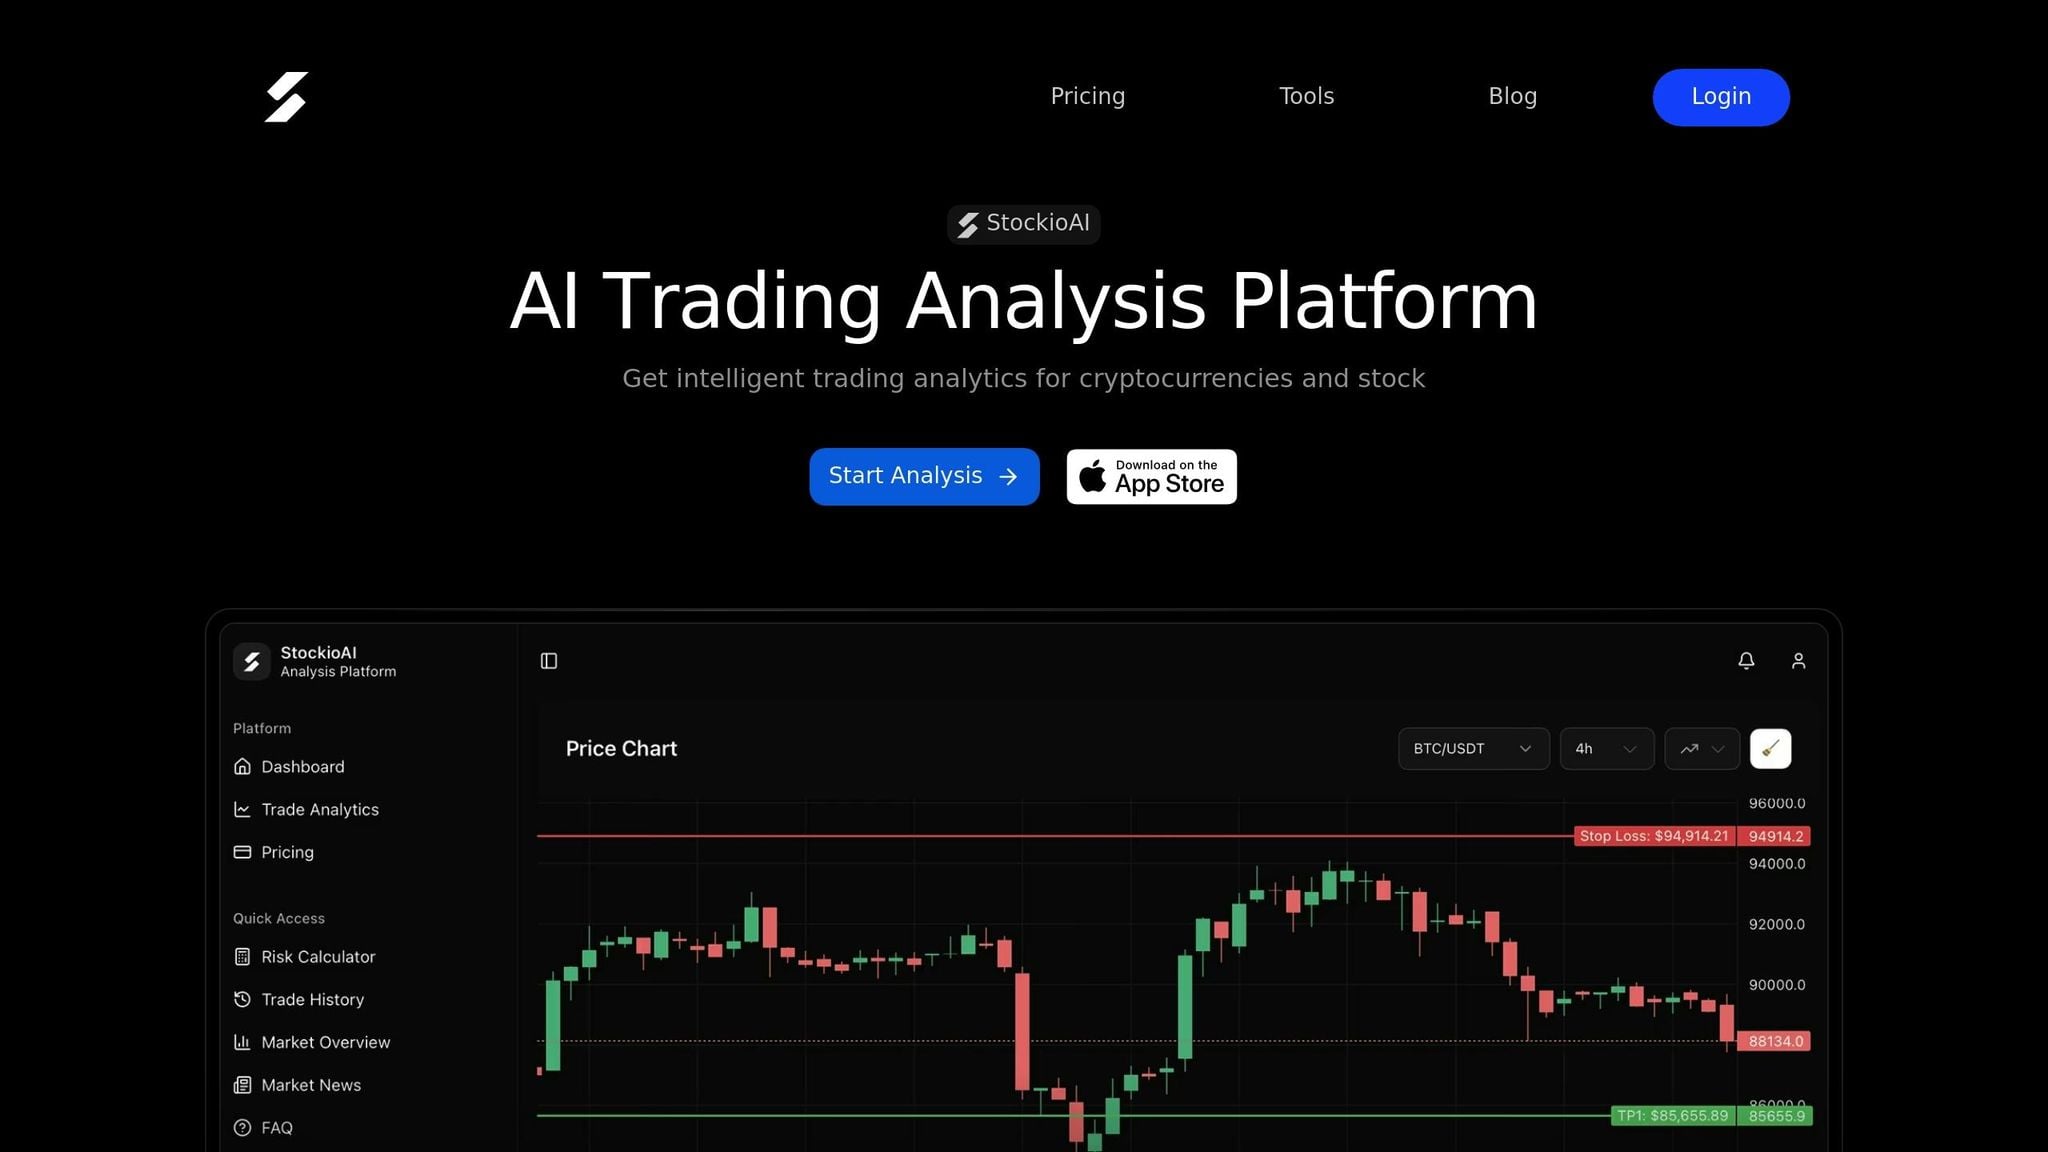
StockioAI makes tracking key trading metrics easier with its integrated tools, processing over 60 real-time data points. These include technical indicators, trading volume, sentiment, and order book depth, all working together to generate actionable BUY, SELL, and HOLD signals. This fast-paced analysis ensures your trading performance stays on track [27]. Plus, its efficient data processing helps identify trends with precision.
The platform's AI-driven pattern recognition is designed to spot emerging trends and reversals that might otherwise go unnoticed. Each trading signal comes with a confidence score, helping you focus on high-probability setups. Additionally, the built-in risk calculator helps determine the ideal position size based on factors like your account balance, risk tolerance, and recommended stop-loss levels. This feature reduces the chances of over-leveraging and minimizes drawdowns, which can impact your profit and loss percentages [27].
For handling transaction volume, StockioAI offers up to 500 AI-generated trading signals per month with its Professional plan, priced at $39/month when billed annually. It also tracks whale movements and institutional flows, offering insights into market microstructure changes that often precede significant price shifts [27]. These capabilities ensure precise volume tracking and better cost management.
The multi-timeframe analysis feature is another standout. It aligns short-term trades with broader market trends, cutting down on false signals and improving your Win Rate. By examining multiple timeframes, the system ensures day trades are in sync with long-term market movements. Professional plan users also benefit from API access, making it easy to integrate these metrics into their existing tracking systems [27].
For beginners, StockioAI offers a Free plan that includes 5 AI trading signals and basic market insights at no cost. The Starter plan, priced at $23/month billed annually, provides 30 signals and essential technical analysis tools. This tiered structure allows users to explore the platform's features before committing to advanced risk management tools [27]. By automating data collection and risk calculations, StockioAI supports the metrics that are critical for successful algorithmic trading.
Conclusion
Keeping an eye on these metrics ensures that algorithmic trading remains grounded in data rather than guesswork. Metrics like the Sharpe Ratio and Maximum Drawdown are especially useful - they help you separate a strategy's true effectiveness from the risks it might be hiding [2][8]. Overlooking regular evaluations, however, can turn small discrepancies between backtests and live performance into significant financial setbacks [2][6].
"In trading, data beats guesswork." - BabyPips [9]
Numbers tell the story, but they need constant monitoring. Reviewing performance over batches of 20–50 trades is a practical way to reduce emotional decision-making and stay disciplined, even during volatile periods [9]. For instance, even a strategy with a 70% win rate can bleed money if the average loss far exceeds the average win [9].
Incorporating these metrics into your trading routine doesn’t have to be a chore. Tools like StockioAI streamline the process by automatically calculating complex metrics and delivering real-time insights. With features like AI-driven pattern recognition, precise trade signals, and a built-in risk calculator, StockioAI eliminates the need for manual spreadsheets, allowing you to focus entirely on making informed decisions.
Ultimately, consistent metric analysis is what sets successful trading apart from costly errors. By tracking these ten metrics - and leveraging automated platforms to do so - you can build a trading approach that's both repeatable and sustainable.
FAQs
What is the Sharpe Ratio, and how does it help evaluate a trading strategy's risk?
The Sharpe Ratio is a key metric for evaluating risk-adjusted returns. It compares a strategy's excess returns - those earned beyond a risk-free rate - to the volatility of those returns. Essentially, it shows how much return you're getting for every unit of risk you take.
A higher Sharpe Ratio signals a more efficient trading strategy. It means you're achieving better returns with less risk involved. This makes it an essential tool for comparing various strategies and pinpointing the ones that strike the best balance between performance and risk.
What is Maximum Drawdown, and why is it important in algorithmic trading?
Maximum Drawdown represents the biggest drop in a portfolio's value, measured from its highest point to its lowest before it begins to recover. This metric plays an important role in algorithmic trading because it shows the worst-case loss a strategy might face, helping traders gauge the risk and durability of their approach.
Keeping an eye on Maximum Drawdown ensures your trading algorithm stays within acceptable risk levels, safeguarding your capital and supporting steady, long-term gains. It also provides valuable insight for adjusting strategies to strike the right balance between risk and reward.
How does transaction volume impact the reliability of a trading strategy?
Transaction volume plays a key role in gauging the reliability of any trading strategy. When trading volumes are high, it usually signals strong market interest, which can enhance liquidity and make it easier to execute trades without significant price changes. On the flip side, low trading volumes often bring higher price swings and can make entering or exiting positions more challenging.
By pairing transaction volume with other performance metrics, traders can get a clearer picture of whether their strategies align with current market conditions. This approach ensures they operate in environments that support steady performance. Keeping an eye on transaction volume not only highlights potential risks but also uncovers opportunities, making it a crucial element for success in algorithmic trading.