AI chart pattern recognition is transforming trading by automating the identification of price patterns like triangles, flags, and head-and-shoulders. These patterns help traders predict market trends and make informed decisions. Unlike manual analysis, AI processes data faster, avoids emotional bias, and works 24/7 across multiple cryptocurrencies and timeframes. Here's what you need to know:
- What it does: Detects patterns in price charts to forecast market trends.
- Why it matters: Overcomes human limitations like subjectivity, fatigue, and data overload.
- How it works: Combines machine learning, deep learning, and computer vision to analyze price data and generate trading signals.
- Key benefits: Speed, accuracy, scalability, and consistent performance.
AI tools like StockioAI enhance trading by providing real-time signals, risk management tools, and multi-timeframe analysis, making them invaluable for navigating the fast-paced cryptocurrency market.
3 Must-Know Algorithms for Automating Chart Pattern Trading in Python
How AI Chart Pattern Recognition Works
AI chart pattern recognition combines machine learning, deep learning, and computer vision to deliver highly accurate, real-time pattern detection. This approach significantly outperforms what human traders can achieve on their own.
Main Components of AI Chart Pattern Recognition
At its core, AI chart pattern recognition depends on three key technologies: machine learning, deep learning, and computer vision. Each plays a distinct role in turning raw price data into actionable insights for traders.
-
Machine learning scours through vast amounts of historical data, refining its criteria to identify subtle variations in chart patterns. Over time, it becomes better at spotting formations that may signal potential market movements.
-
Deep learning uses neural networks designed to mimic human brain functions. These networks detect complex relationships in price behavior that simpler algorithms often miss. This is especially useful in cryptocurrency markets, where price movements can differ significantly from traditional financial instruments.
-
Computer vision allows AI to analyze chart patterns visually, much like a human trader would. Instead of focusing solely on numerical data, the AI examines candlestick charts for shapes, trends, and formations. This visual analysis helps uncover patterns that might be missed when only looking at raw numbers.
By combining these technologies, the system provides a comprehensive analysis. Machine learning lays the statistical groundwork, deep learning uncovers intricate patterns, and computer vision ensures accuracy in visual interpretation. Together, they enable the AI to process both numerical and visual data seamlessly.
Step-by-Step Process of AI Pattern Recognition
AI chart pattern recognition follows a systematic process to transform data into actionable trading signals. Here’s how it works:
-
Data Collection: The AI ingests real-time data, including OHLC (open, high, low, close) prices and volume, from multiple exchanges. This ensures the data is complete and accurate. Volume data, in particular, helps gauge the strength behind price movements.
-
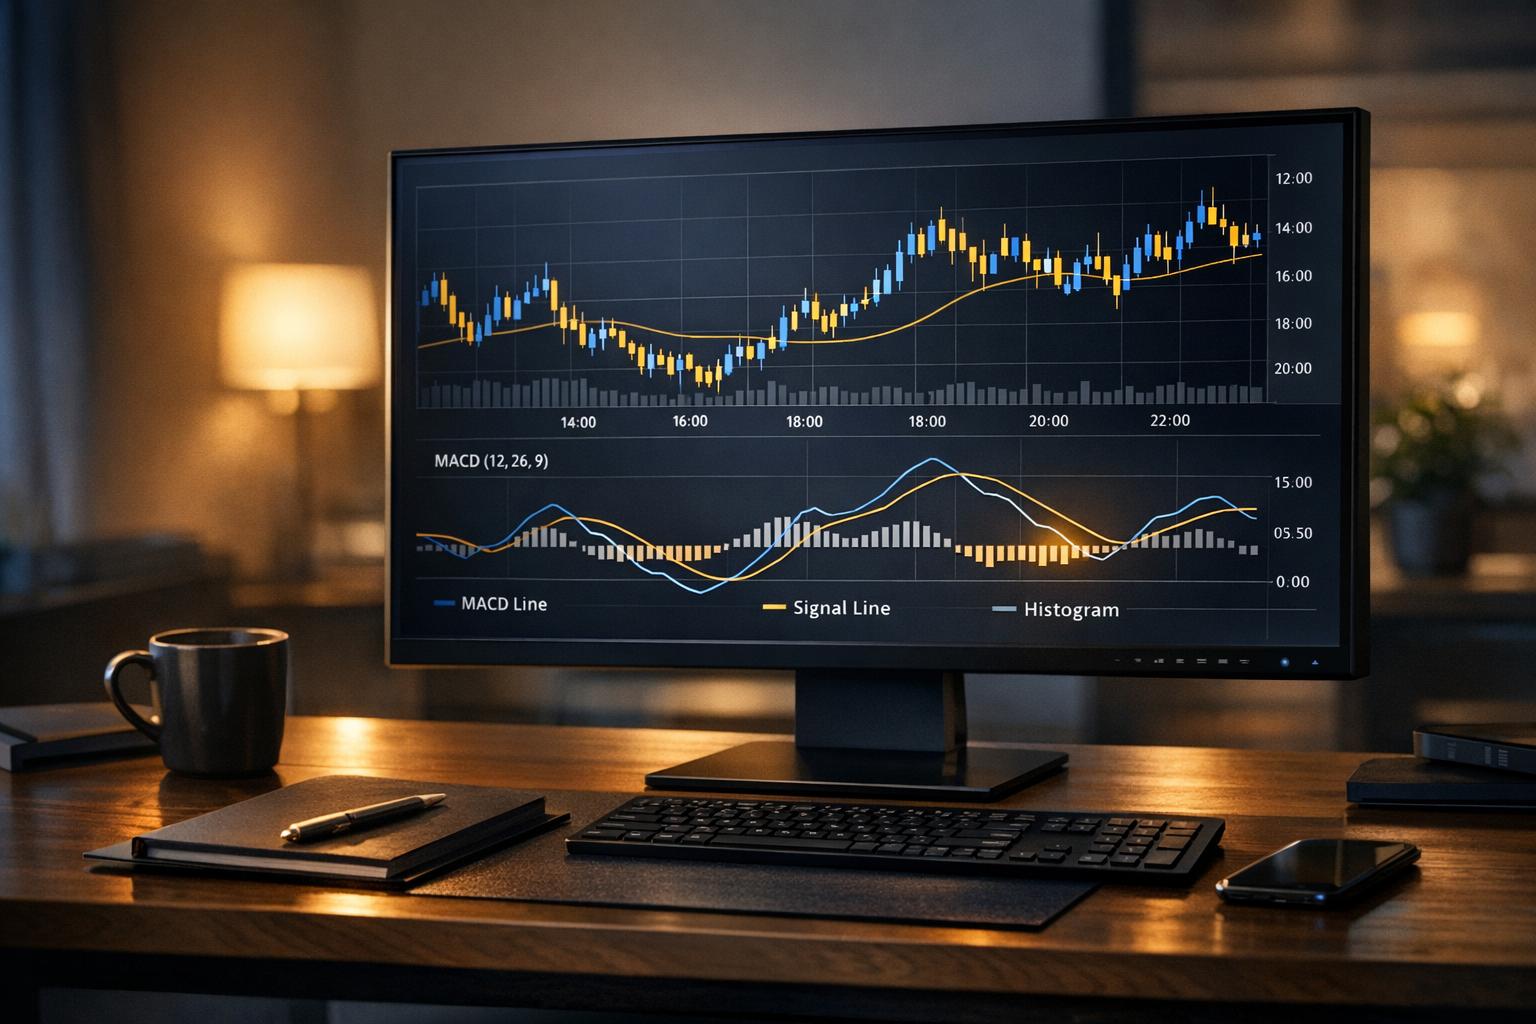
Feature Extraction: The system identifies key characteristics within the data, such as technical indicators like moving averages, RSI, and Bollinger Bands. It also evaluates geometric features, including slope angles, pattern symmetry, and breakout levels.
-
Pattern Classification: This is the core step where the AI compares the extracted features against its database of known patterns. It evaluates variations and assigns probability scores based on how closely the current formation matches successful historical patterns.
-
Signal Generation: Once a pattern is classified, the AI generates trading signals. These include buy, sell, or hold recommendations, along with confidence levels, price targets, and suggested stop-loss points. The system also factors in market conditions, volatility, and the historical success of similar patterns.
Throughout this process, the AI operates in a feedback loop. It learns from the outcomes of its predictions, reinforcing successful recognition parameters and adjusting criteria when predictions fall short. This ensures continuous improvement in accuracy.
Real-Time Analysis and Multi-Timeframe Data
AI systems don’t just stop at initial pattern detection - they refine their analysis in real time and across multiple timeframes.
-
Multi-Timeframe Analysis: The AI examines the same cryptocurrency across different timeframes, from one-minute charts for short-term trades to daily and weekly charts for long-term trends. This layered approach ensures that patterns are analyzed in context. For example, a bullish signal on a 15-minute chart carries more weight if it aligns with upward trends on four-hour and daily charts. Conversely, short-term patterns that contradict broader trends are given lower confidence scores, helping traders avoid false signals.
-
Real-Time Processing: The AI continuously monitors the market, identifying patterns as they evolve. It doesn’t wait for a formation to fully develop; instead, it alerts traders to potential opportunities early. This can be a game-changer in fast-moving markets like cryptocurrency, where timing is critical.
-
Adaptive Algorithms: Cryptocurrency markets are known for their volatility, and patterns that work in stable conditions may behave differently during periods of high volatility. The AI adapts to these changes, ensuring it remains effective regardless of market conditions. This adaptability extends to recognizing pattern evolution, providing traders with insights as formations develop.
AI chart pattern recognition represents a leap forward in trading analysis. By leveraging advanced technologies and real-time capabilities, these systems offer traders unparalleled insights into market behavior and potential opportunities.
Common Chart Patterns AI Can Detect
AI systems excel at spotting chart patterns that human traders might overlook or misinterpret. These patterns are grouped into three main categories, each offering insights that can help traders decide when to enter or exit the market. By analyzing these patterns, AI provides a clearer picture of market dynamics, especially in cryptocurrency trading.
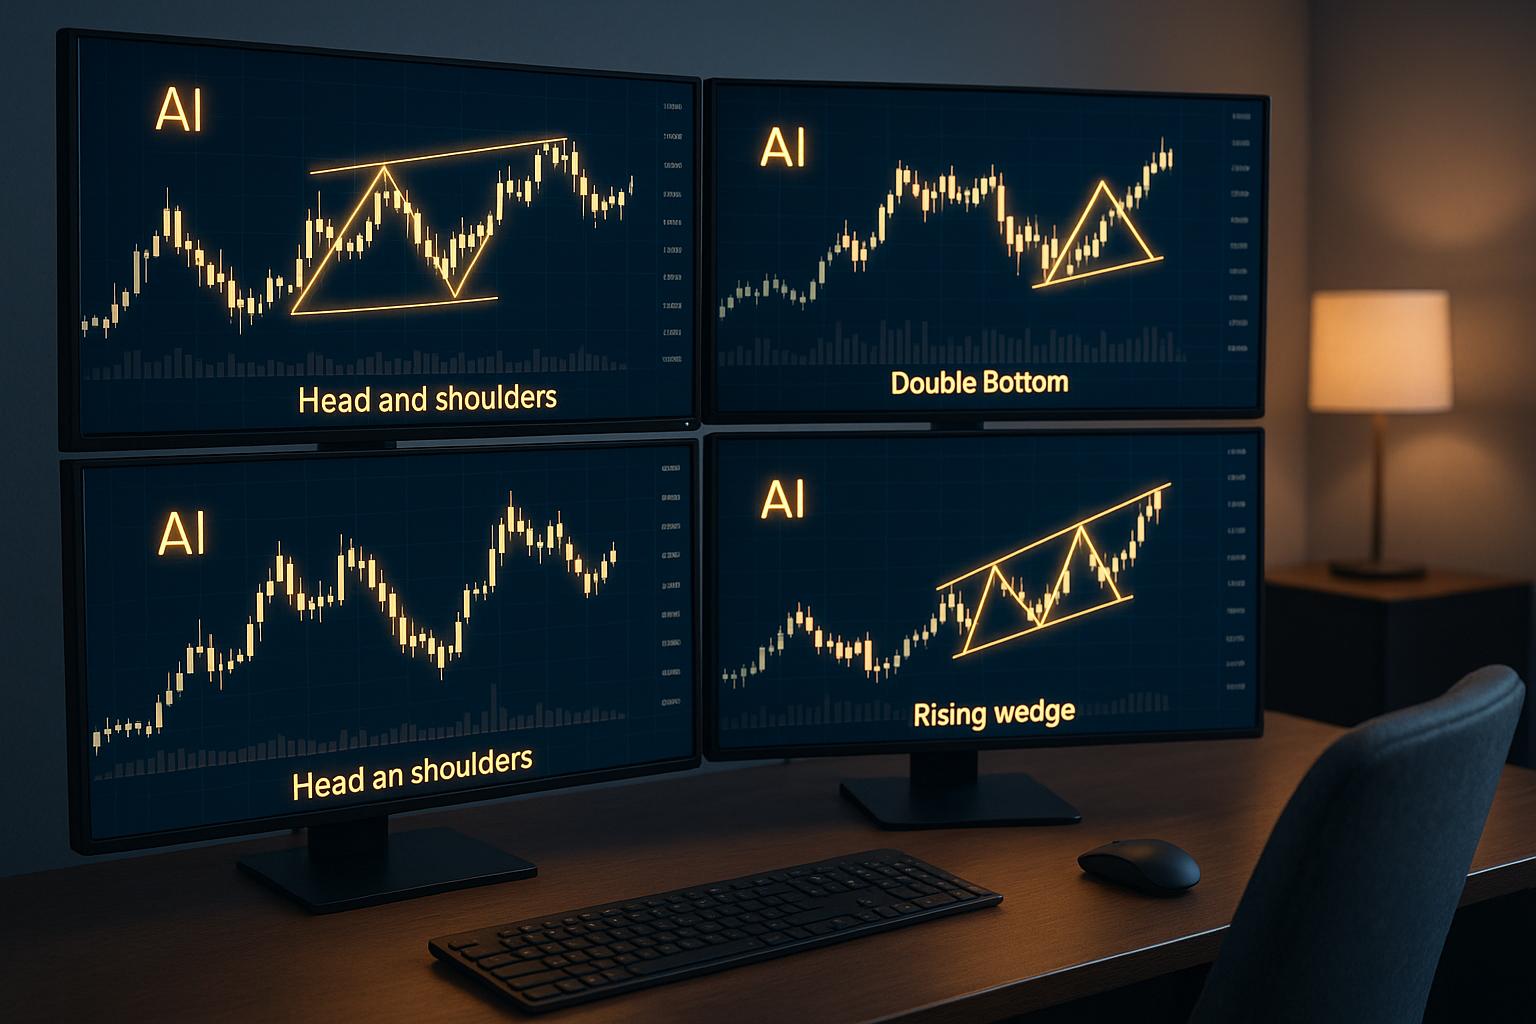
Reversal Patterns
Reversal patterns indicate a potential shift in market direction, making them crucial for traders aiming to capitalize on trend changes. AI's ability to process multiple factors simultaneously makes it especially adept at identifying these formations.
-
Head and Shoulders: This classic pattern consists of three peaks, with the middle peak (the "head") rising higher than the two outer peaks (the "shoulders"). AI tracks volume changes - typically, volume decreases as the pattern forms and surges during the breakout. It also calculates price targets by measuring the vertical distance between the head and the neckline.
-
Double Top and Double Bottom: For double tops, AI looks for two peaks at similar levels separated by a valley. The pattern becomes valid when the price drops below the valley's low point. Conversely, double bottoms involve two troughs at similar levels, with the pattern confirmed when the price breaks above the peak between the two lows. AI ensures precision by analyzing peak heights and spacing.
-
Inverse Head and Shoulders: This bullish reversal pattern is the opposite of the standard head and shoulders. AI identifies three troughs, with the middle one (the "head") lower than the outer two. Rising volume during the formation of the final shoulder and the breakout further validates the pattern.
These reversal patterns are essential for spotting market shifts, allowing traders to adjust their strategies accordingly.
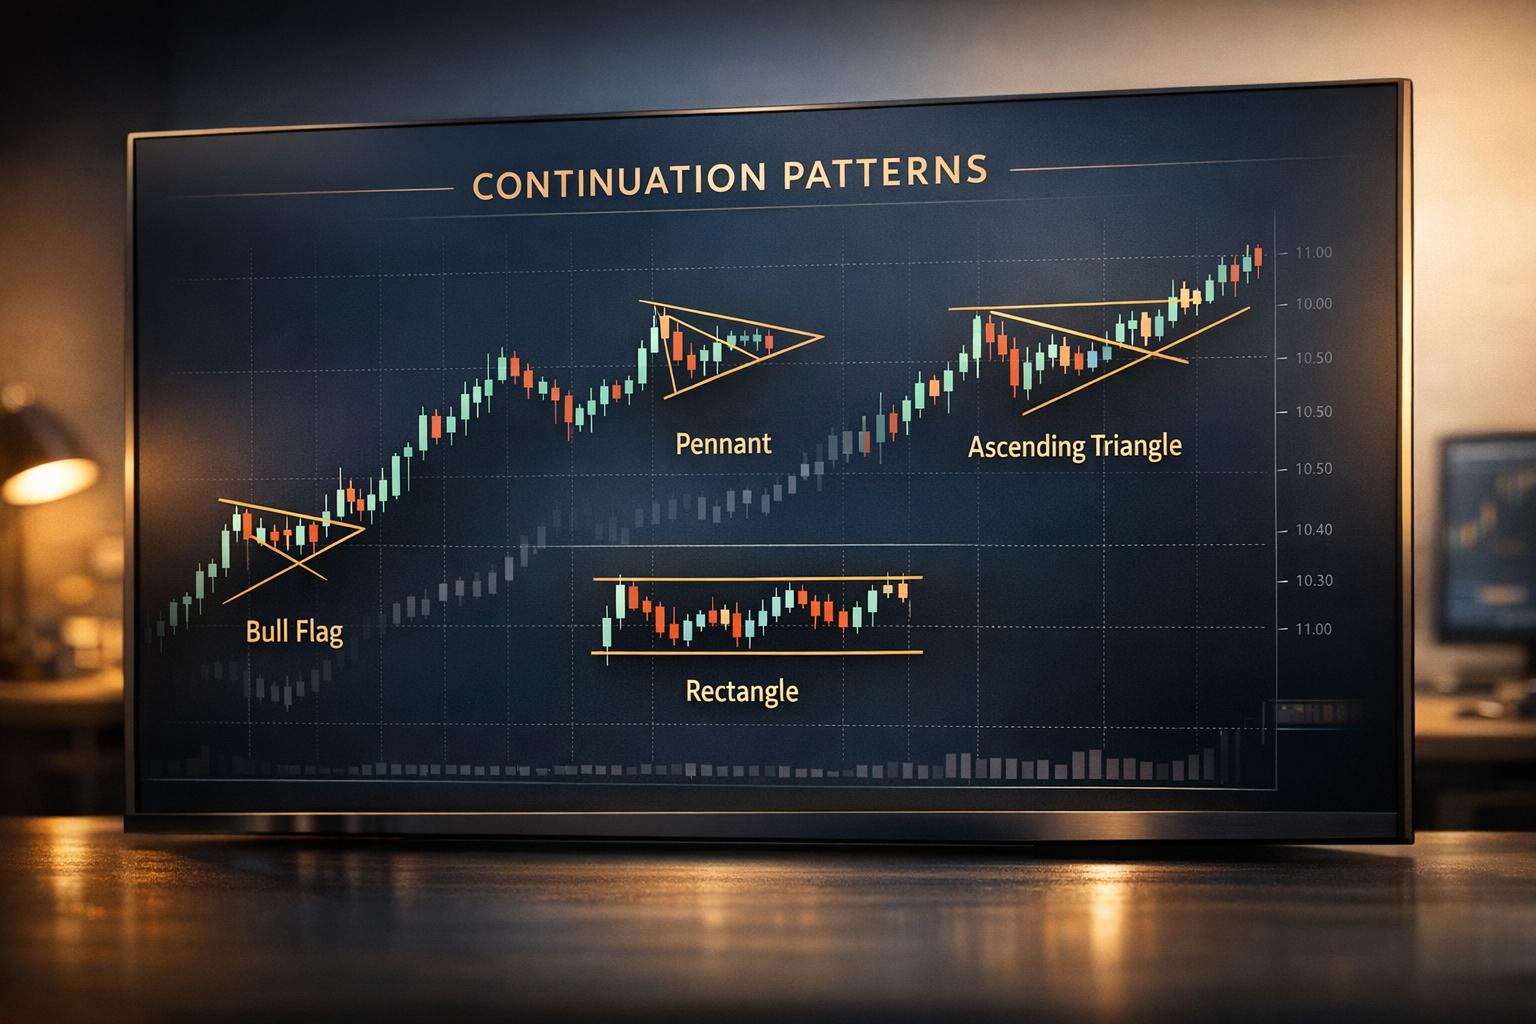
Continuation Patterns
Continuation patterns suggest that a current trend will likely resume after a brief pause. AI examines these patterns across various timeframes, offering traders a detailed understanding of trend strength and duration.
-
Flag Patterns: These appear as small, rectangular consolidations sloping against the prevailing trend. AI ensures the flagpole (the initial strong move) is followed by a consolidation retracing no more than 38% of the original move. Volume should decrease during the flag's formation and spike during the breakout.
-
Pennant Formations: Similar to flags but triangular in shape, pennants involve converging trend lines. AI measures the angles of these lines and monitors volume, which should decrease during formation and surge upon breakout. Price targets are calculated by projecting the flagpole's length from the breakout point.
-
Triangle Patterns: These include ascending, descending, and symmetrical triangles. AI measures the height of the triangle at its widest point and uses it to project potential breakout targets.
Continuation patterns help traders remain aligned with the prevailing trend, even during short-term consolidations.
Support and Resistance Patterns
These patterns highlight critical price levels where buying or selling pressure tends to emerge. AI's ability to process vast amounts of historical price data makes it highly effective at validating these levels.
-
Wedge Patterns: Sloping in the direction of the trend, wedges often signal reversals. Rising wedges, with upward-sloping support and resistance lines, are bearish, while falling wedges, which slope downward, are usually bullish. AI monitors the angle of convergence and tracks volume, which typically decreases during the wedge's formation and spikes during the breakout.
-
Channel Patterns: These consist of parallel trend lines that contain price movements. Ascending channels slope upward, while descending channels slope downward. AI measures the channel's width and evaluates how consistently price reacts at its boundaries.
-
Rectangle Patterns: Formed when price moves sideways between horizontal support and resistance levels, rectangles are confirmed when AI detects at least two touches of each level. Price targets are projected based on the rectangle's height after a breakout.
Support and resistance patterns are invaluable for identifying key price levels where market dynamics often shift, providing traders with actionable insights for their strategies.
Benefits of AI Chart Pattern Recognition for Traders
AI-driven chart pattern recognition transforms trading by providing fast, emotion-free signals and automated risk management. These tools not only enhance trading results but also reduce the stress and time commitment typically associated with manual pattern analysis.
Real-Time Signals and Risk Management
Modern AI platforms analyze over 60 real-time data points - including technical indicators, volume, support/resistance levels, and market sentiment - to deliver accurate BUY, SELL, and HOLD signals[1]. For BUY signals, the system lays out clear entry points, stop-loss levels, profit targets, and confidence scores. This helps traders align their decisions with their personal risk tolerance and current market conditions.
When it's time to SELL, AI continuously monitors market dynamics to identify the most favorable exit points. HOLD recommendations, on the other hand, are based on assessing sideways trends, correlations, and market microstructure. These insights are supported by live updates on support/resistance levels, upcoming catalysts, and evolving conditions.
AI also includes built-in risk calculators to determine optimal position sizes, stop-loss settings, and leverage. These features create a framework for more reliable and data-driven trading decisions, paving the way for the consistent performance discussed in the next section.
Improved Accuracy and Consistency
AI systems eliminate the emotional decision-making and fatigue that often hinder manual trading. Unlike human traders, who might overlook patterns during off-hours or under pressure, AI maintains a steady level of performance 24/7.
Take StockioAI, for example. This platform boasts a 75.0% win rate on its AI-driven trading strategies. Starting with $1,000 in capital, it delivered a +2.9% total return, generating $744.22 in revenue with a Profit Factor of 2.95[1].
"StockioAI revolutionized my trading strategy. The AI insights helped me achieve consistent 18% monthly returns." - Jordan Martinez, Quantitative Trader
By leveraging advanced machine learning, these systems pinpoint chart patterns, trend reversals, and optimal trade setups with precision. Each pattern undergoes rigorous validation to meet strict mathematical criteria before triggering a signal, minimizing false positives. This level of reliability, combined with the scalability of AI, ensures traders can make the most of every opportunity.
Scalability and Multi-Asset Coverage
One of AI's standout features is its ability to track multiple assets and timeframes simultaneously. While human traders are limited to monitoring a handful of markets, AI systems scan hundreds of trading pairs across various exchanges, ensuring no opportunity slips through the cracks.
Real-time notifications alert traders to critical pattern developments or necessary position adjustments. In the fast-moving cryptocurrency market, this scalability allows traders to act on opportunities at any time and diversify their strategies by analyzing patterns across a wide range of assets. AI's ability to work around the clock ensures traders stay ahead, no matter the market conditions.
StockioAI: AI-Powered Cryptocurrency Trading Platform
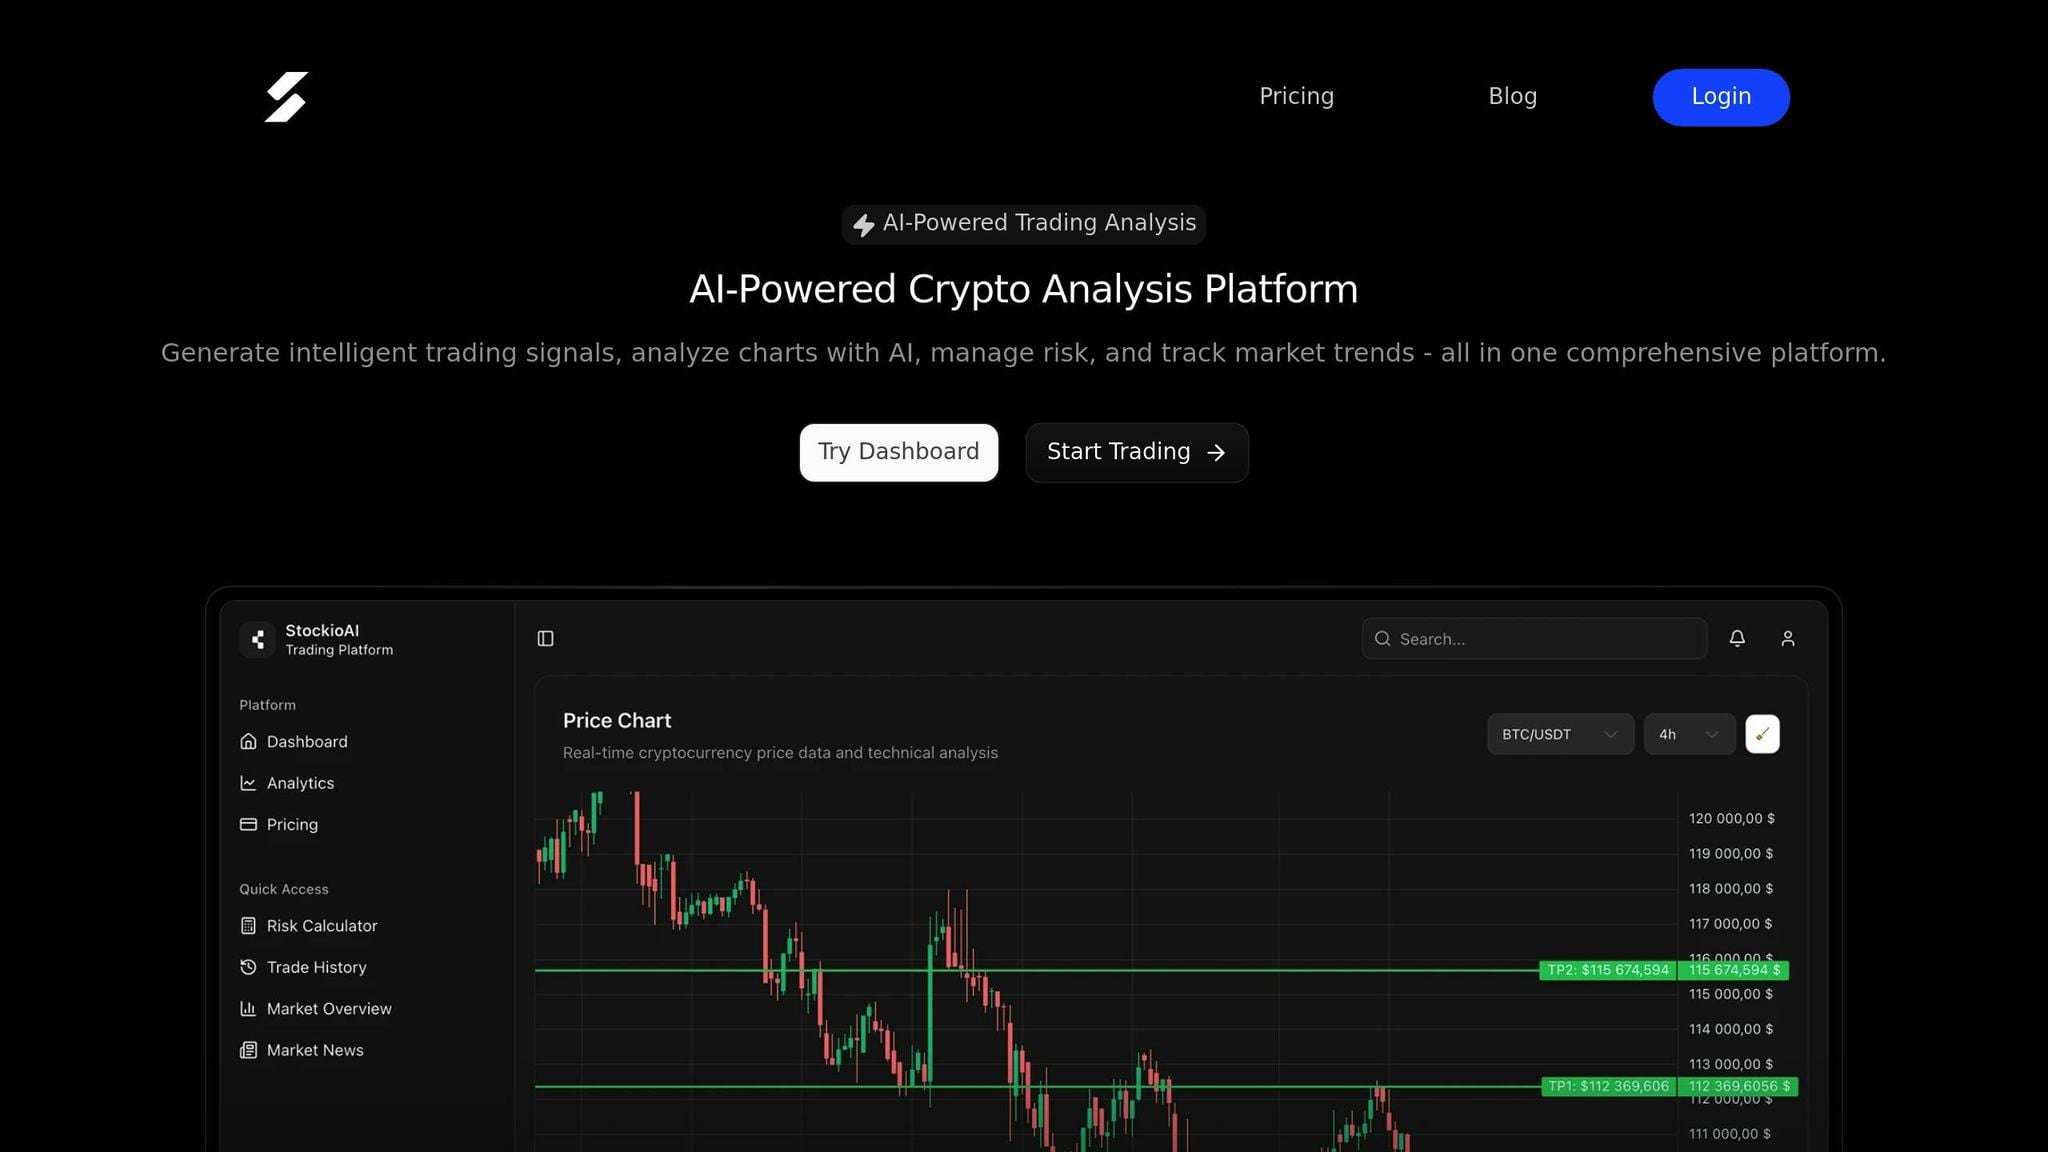
StockioAI stands out as a cutting-edge cryptocurrency trading platform that leverages AI and machine learning to analyze real-time market data. By processing more than 60 data points every second, it identifies chart patterns and generates actionable trading signals[2].
Key Features for Chart Pattern Recognition
StockioAI's AI Pattern Recognition system is designed to spot chart patterns, detect trend reversals, and pinpoint optimal entry and exit points across various cryptocurrency markets. The platform provides traders with detailed BUY, SELL, and HOLD recommendations, complete with entry/exit points, stop-loss levels, profit targets, and confidence scores for each signal[2].
The Interactive Chart Analysis feature overlays AI-driven trading levels, support and resistance zones, and technical indicators on advanced charts. This visual tool combines traditional technical analysis with AI insights, giving traders a clear picture of market trends. Additionally, the platform's Multi-Timeframe Analysis ensures that signals from higher timeframes take precedence, offering a broader perspective on market conditions.
StockioAI also includes a Risk Calculator, which determines optimal position sizes, stop-loss levels, and leverage based on current market dynamics. Its Market Regime Classification feature helps traders identify whether the market is trending, ranging, volatile, or quiet, enabling them to adjust their strategies for better results.
At the heart of StockioAI is its 7-Tier Priority System, which evaluates market structure, volume, trend phases, and key technical indicators. This structured approach ensures that the most critical signals are prioritized in its pattern recognition process.
Together, these features provide traders with a sophisticated, data-driven framework for chart analysis and decision-making.
Benefits for Cryptocurrency Traders
StockioAI's advanced metrics ensure its strategies are effective in dynamic market conditions. One standout feature is the Conflict Resolution Matrix, which manages 15 different scenarios for position sizing. This ensures traders receive consistent guidance, even when multiple patterns or signals present conflicting information.
For active traders, the platform offers portfolio tracking, allowing simultaneous monitoring of multiple positions across various cryptocurrency pairs. This feature integrates seamlessly with the pattern recognition system, providing a unified view of position management and performance analysis.
Pricing Plans for All Traders
StockioAI offers flexible pricing options to suit traders at different experience levels:
| Plan | Monthly Price | Annual Price | Trading Signals | Key Features |
|---|---|---|---|---|
| Free | $0 | $0 | 3 total | Basic market insights, educational resources |
| Starter | $49 | $39 | 30 per month | Basic technical analysis, email support, standard indicators |
| Professional | $99 | $79 | 500 per month | Advanced pattern recognition, priority support, portfolio tracking, API access |
Annual subscribers can save 20% on both the Starter and Professional plans[2]. The Free Plan is perfect for newcomers, offering three trading signals to test StockioAI's capabilities before committing to a paid plan.
The Professional Plan caters to serious traders, including tools like advanced risk management, a custom indicator library, and API access. These features are particularly beneficial for those who require detailed market analysis and comprehensive trading tools to stay ahead in the fast-paced cryptocurrency market[2].
Conclusion: The Future of Cryptocurrency Trading with AI
Key Takeaways
AI is reshaping the way traders approach cryptocurrency markets, and its capabilities are nothing short of game-changing. By processing massive amounts of data in real time, AI can spot patterns and trends far faster than any human trader. It eliminates emotional decision-making, ensures consistency, and provides multi-timeframe analysis to align signals with broader market trends. When faced with conflicting signals, AI’s advanced algorithms step in to reconcile them, helping traders stick to their strategies even during turbulent times.
With its ability to deliver real-time insights, analyze multiple timeframes, and manage risk with precision, AI offers traders a significant edge. These advancements highlight how tools like StockioAI are redefining what’s possible in cryptocurrency trading.
The Role of Platforms Like StockioAI
As the cryptocurrency market evolves, platforms such as StockioAI are at the forefront of this transformation. StockioAI’s 7-Tier Priority System and advanced pattern recognition technology bring sophisticated trading strategies within reach for everyone - not just institutional investors.
What’s more, StockioAI offers flexibility through its pricing plans. The free plan provides three AI signals, giving traders a risk-free way to explore AI-driven analysis. For those ready to dive deeper, the Professional plan, priced at $99 per month, delivers 500 AI trading signals along with portfolio tracking and API access. This setup brings institutional-grade tools to individual traders, leveling the playing field.
As AI technology advances, platforms that combine real-time data analysis, strong risk management features, and easy-to-use interfaces will be essential for navigating the ever-changing cryptocurrency landscape.
FAQs
How does AI chart pattern recognition improve trading accuracy and efficiency compared to traditional methods?
AI-driven chart pattern recognition provides traders with a clear advantage over traditional methods by offering enhanced precision and quicker decision-making. These systems analyze patterns with a level of accuracy that often outperforms even the most seasoned human analysts, giving traders access to more dependable insights.
What sets AI apart is its ability to process massive amounts of market data in real-time. This rapid analysis is especially valuable in fast-paced markets like cryptocurrencies, where even slight delays can mean missed opportunities. By combining speed with accuracy, AI tools simplify the trading process, helping traders act decisively and with added confidence.
How do machine learning, deep learning, and computer vision enable AI to recognize chart patterns?
Machine learning, deep learning, and computer vision form the backbone of AI-powered chart pattern recognition. Machine learning focuses on training algorithms to spot trends and recurring behaviors in historical data, making it easier to identify patterns. Deep learning takes this a step further by working with raw data to uncover intricate, layered patterns, enhancing the accuracy and reliability of predictions. Meanwhile, computer vision handles the visual side of things, analyzing elements like candlestick charts and geometric shapes to interpret chart data with precision.
When combined, these technologies enable AI to automatically detect patterns and provide actionable insights, helping traders make smarter decisions in the fast-paced world of cryptocurrency markets.
How does StockioAI handle the unpredictable nature of cryptocurrency markets?
StockioAI is built to thrive in the ever-changing and unpredictable world of cryptocurrency trading. It leverages AI-powered algorithms and machine learning models to process massive amounts of data in real-time. This enables the platform to detect market trends and react to sudden price shifts in mere milliseconds.
By keeping a constant watch on market conditions, StockioAI adjusts its strategies on the fly. This helps traders navigate risks while taking advantage of emerging opportunities. Its capability to anticipate potential market swings gives users the tools to make smarter decisions, even when the trading environment is at its most volatile.