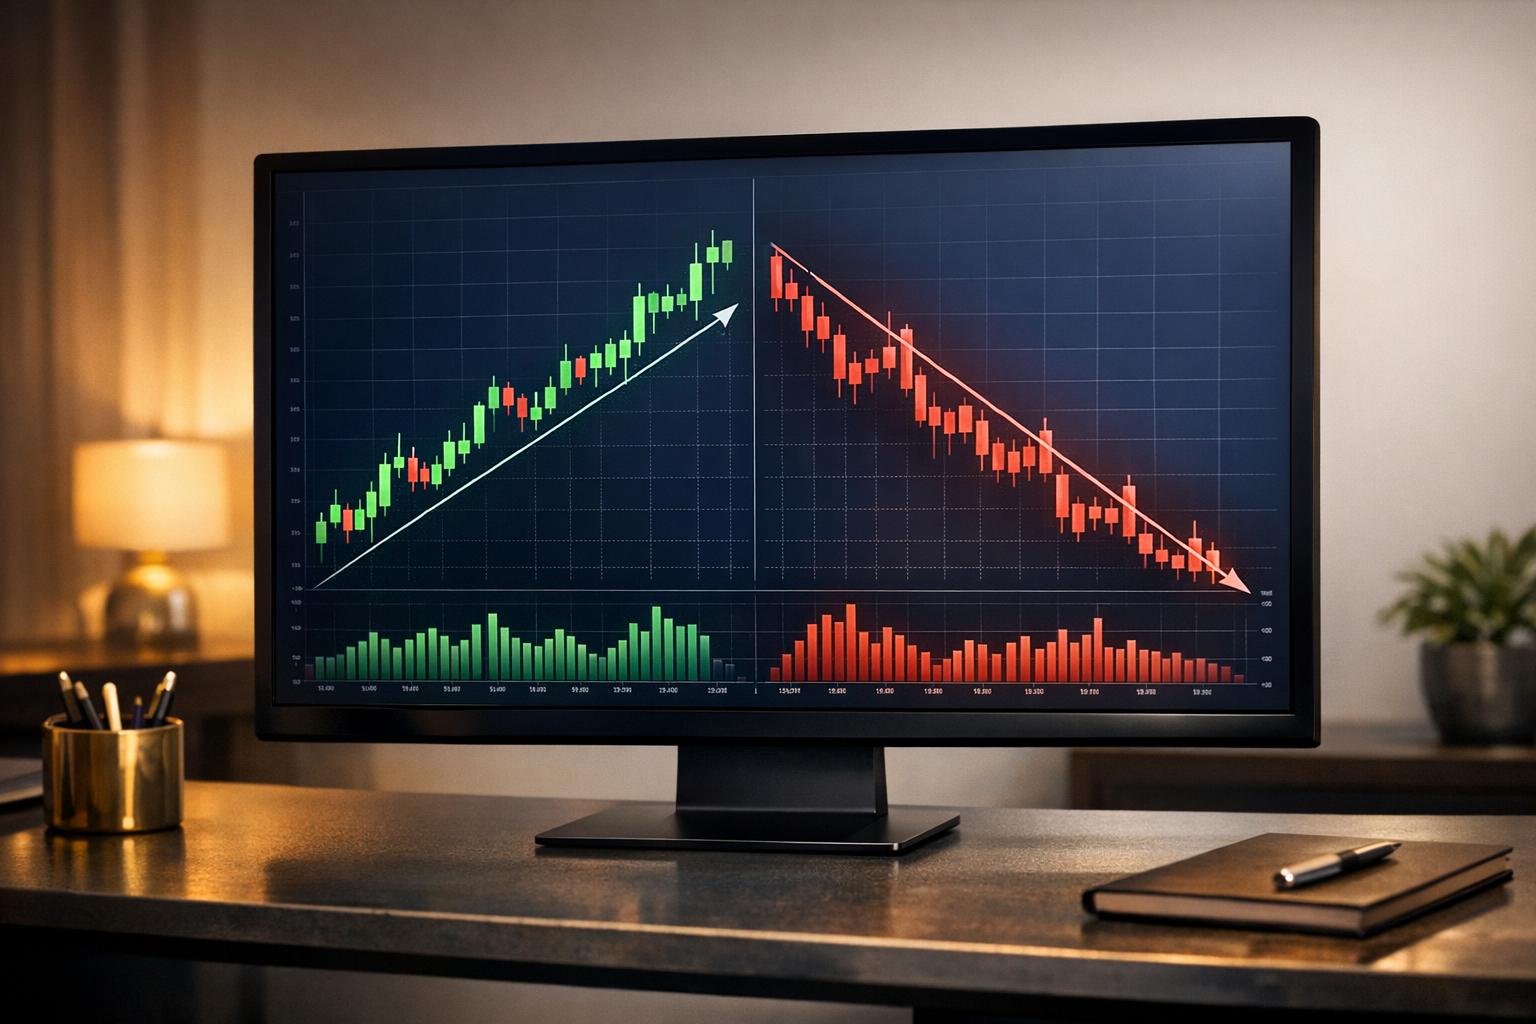
Chart patterns are essential tools in technical analysis, helping traders predict price movements by analyzing market trends. These patterns behave differently depending on whether the market is bullish (rising) or bearish (falling). Here's what you need to know:
- Bull markets feature rising prices, optimism, and higher highs/lows. Patterns like bull flags and cup-and-handle thrive here.
- Bear markets involve falling prices, fear, and lower highs/lows. Bearish patterns like bear flags and head-and-shoulders dominate.
- Volume plays a key role in confirming patterns. For example, breakouts often need a 50% volume spike to validate the move.
- Tools like StockioAI help traders by identifying patterns, analyzing volume, and aligning strategies with market conditions.
Quick Comparison
| Pattern | Bull Market Behavior | Bear Market Behavior |
|---|---|---|
| Flags | Downward consolidation after a rally | Upward consolidation after a drop |
| Head & Shoulders | Bearish reversal at peaks | Bullish reversal at troughs |
| Triangles | Rising lows signal continuation | Falling highs suggest breakdowns |
| Double Tops/Bottoms | "W" shape for bullish reversals | "M" shape for bearish reversals |
Chart patterns are more reliable when combined with volume analysis and risk management. Bullish patterns succeed about 67% of the time, while bearish ones hit 64%. Using AI tools can reduce errors and improve decision-making, especially in volatile markets.

How Common Chart Patterns Compare in Bull and Bear Markets
Chart Patterns Comparison Table
Chart patterns often behave in a similar way in both bull and bear markets, but with reversed dynamics. For instance, a bull flag slopes downward during an uptrend as traders take profits, while a bear flag slopes upward during a downtrend as short-sellers cover their positions or buyers step in to find bargains [1][7].
Both patterns start with a high-volume flagpole. For bull flags, this is marked by a sharp upward spike, while bear flags begin with a steep drop. The consolidation phase that follows typically spans 5 to 15 price bars and retraces 30% to 50% of the flagpole's height. If the retracement exceeds 50%, the pattern's reliability decreases significantly [8][9].
| Pattern | Bull Market Behavior | Bear Market Behavior | Key Difference |
|---|---|---|---|
| Flags | Downward-sloping consolidation after a sharp rally; volume usually decreases | Upward-sloping consolidation after a steep decline; volume can hold steady or rise [1][7] | Reflects profit-taking in bull markets versus short-covering in bear markets |
| Head & Shoulders | Acts as a bearish reversal pattern at market peaks, with around a 70% success rate [2][13] | Appears as an inverse head and shoulders, signaling a bullish reversal [2][13] | Both indicate trend reversals but in opposite directions |
| Triangles (Ascending) | About 75% success rate as a bullish continuation pattern, with horizontal resistance and rising support [2] | Less reliable in bear markets; often fails to sustain the trend | Performs better in bullish conditions |
| Double Tops/Bottoms | Double bottoms (W-shape) are strong bullish reversal patterns, with success rates between 65–79% [13] | Double tops (M-shape) are less effective as bearish reversal signals | Markets tend to recover more robustly from bottoms than they decline from tops |
| Pennants | Small symmetrical triangles with converging trendlines, signaling brief pauses before continuation | Similar structure but resolve faster, especially in 24/7 trading environments like crypto [1][10] | Quicker resolution in continuously traded markets like crypto |
Double tops form an "M" shape after uptrends, signaling bearish reversals, while double bottoms create a "W" shape after downtrends, signaling bullish reversals. Double bottoms often perform better due to the market's tendency to recover more sustainably than it declines [6][13]. These nuances highlight the importance of analyzing volume to confirm the reliability of patterns across different market conditions.
Volume and Reliability Differences Between Market Types
Volume analysis provides an extra layer of insight into how reliable patterns are in varying market conditions. Volume acts as a confirmation tool for genuine breakouts. During the consolidation phase, volume typically declines as buyers and sellers reach a temporary balance. However, in bear flags, volume may remain steady or even rise due to aggressive short-covering [1][2][11].
When a pattern breaks out, a volume spike - ideally 50% above recent averages - serves as a strong confirmation of the move [2][12]. Without this surge, the breakout is likely to fail. Bullish continuation patterns have a success rate of about 67%, while bearish patterns succeed around 64% [11]. Specifically, bear flags in strong downtrends show a continuation rate of 60–70%, with a median follow-through of approximately 8% after confirmed breakouts [12].
"Bullish continuation patterns are like a pause button for uptrends. They give traders a chance to catch their breath before the next leg up."
– John J. Murphy, Technical Analysis of the Financial Markets [11]
Daily and weekly chart patterns tend to be 15–20% more reliable than intraday patterns because they filter out noise [2]. In crypto markets, where trading happens 24/7, flagpoles form continuously instead of through overnight gaps as in traditional stock markets. This makes volume analysis more detailed but also more fragmented across different exchanges [10].
Individual Chart Patterns: Bull vs. Bear Market Behavior
Bull Flags vs. Bear Flags
Bull and bear flags share a similar structure with a sharp flagpole and a period of consolidation, but they represent opposing market trends. A bull flag forms when prices shoot up on high volume, followed by a brief consolidation phase, often signaling temporary profit-taking. On the other hand, a bear flag starts with a steep price drop, followed by a short upward consolidation, typically driven by short-covering.
"The flagpole... shows that buyers or sellers are very confident and aggressive. A steeper and more decisive flagpole indicates a stronger trend and makes the entire pattern more reliable" – Zain Vawda, OANDA [1]
In both cases, volume spikes during the flagpole, dips during consolidation, and increases again on breakout. Ideally, consolidations retrace 30–50% of the flagpole's height, while retracements beyond 50% make the pattern less dependable [8].
Take SOLS in late 2023 as an example of a bull flag. After being listed on Gate.io, the token surged to about $2.00 on high volume, consolidated over five 30-minute periods with lower volume, and then broke out toward $3.00 [10]. Contrast this with Bitcoin in May 2022, which formed a bear flag. Following a steep drop on high volume, Bitcoin consolidated upward between $21,000 and $25,000 for about a month before resuming its downtrend, eventually hitting a new yearly low [10].
Traders typically enter bull flags when prices close above the upper trendline and bear flags when prices close below the lower trendline. Stop-losses are placed just outside the consolidation area, while profit targets are estimated by measuring the flagpole's height and projecting that distance from the breakout point [1][14]. Traders can practice these entries and exits using a crypto trading signal simulator to refine their strategy.
Head and Shoulders in Trending Markets
Reversal patterns like the head and shoulders offer valuable insights into market shifts. In a bull market, a standard head and shoulders top signals a potential reversal from an uptrend to a downtrend. This pattern features three peaks - left shoulder, head, and right shoulder - with the right shoulder being lower, indicating fading buyer strength [15].
In a bear market, the inverse head and shoulders pattern signals a bullish reversal. This version displays three troughs, with the middle one (the head) being the deepest. A shallower right trough suggests that selling pressure is weakening, and the reversal is confirmed when prices break above the neckline resistance [16].
Between July 19 and August 24, the Invesco QQQ Trust (QQQ) formed an inverse head and shoulders pattern after an 8.57% drop from $387.98 to $354.76. The head reached a low of $354.70, and on August 21 at 1:15 PM, QQQ broke above the neckline, achieving a bullish target of $370.66 by August 24 [16].
This highlights the importance of waiting for a clear neckline break. Conservative traders often prefer to see a retest of the neckline before entering a trade. To set targets, measure the vertical distance from the head to the neckline and project that from the breakout point. Stop-losses are usually placed above the right shoulder (or head) in a standard pattern or below the right shoulder (or neckline) in an inverse pattern [15][16].
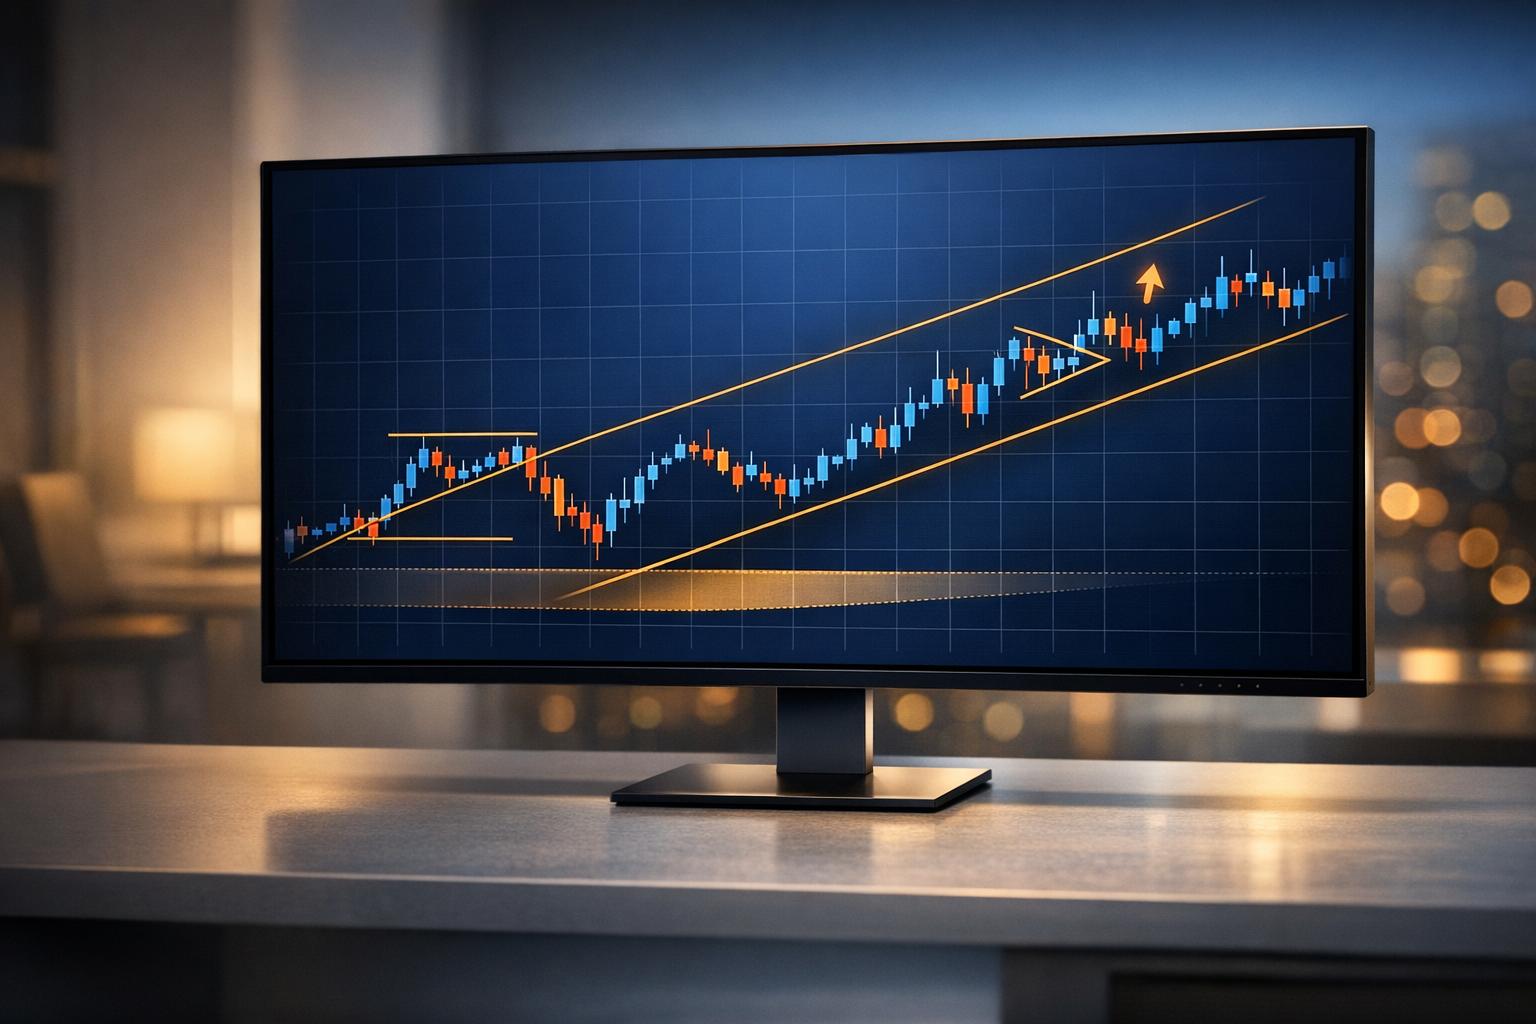
Triangles and Pennants: Continuation Signals
Continuation patterns like triangles and pennants help traders assess ongoing market momentum using a crypto market trend analyzer. In bull markets, ascending triangles feature a flat resistance line and rising lows, signaling growing buyer confidence. In bear markets, descending triangles show a flat support line and falling highs, pointing to sustained selling pressure [11][18].
Symmetrical triangles, characterized by converging trendlines, reflect market indecision and may break in either direction, though they often follow the prevailing trend. Pennants, which are smaller symmetrical triangles, form after sharp price moves and act as brief pauses before the trend resumes. These typically resolve faster than larger triangles [11].
Volume tends to decrease during the pattern's formation and then surge during the breakout [8][11]. Bullish continuation patterns historically succeed about 67% of the time, while bearish ones have a 64% success rate. On average, these patterns capture 65–70% of the prior trend's movement [11].
For bullish triangles and pennants, traders typically enter when prices close above the resistance line on increased volume. In bearish patterns, entry points are when prices close below the support line. Stop-losses are placed just outside the pattern's opposite boundary, and profit targets are estimated by measuring the height of the preceding move and projecting that distance from the breakout point [17][8].
Using AI-Powered Pattern Recognition to Adjust Your Strategy
How StockioAI Improves Chart Analysis
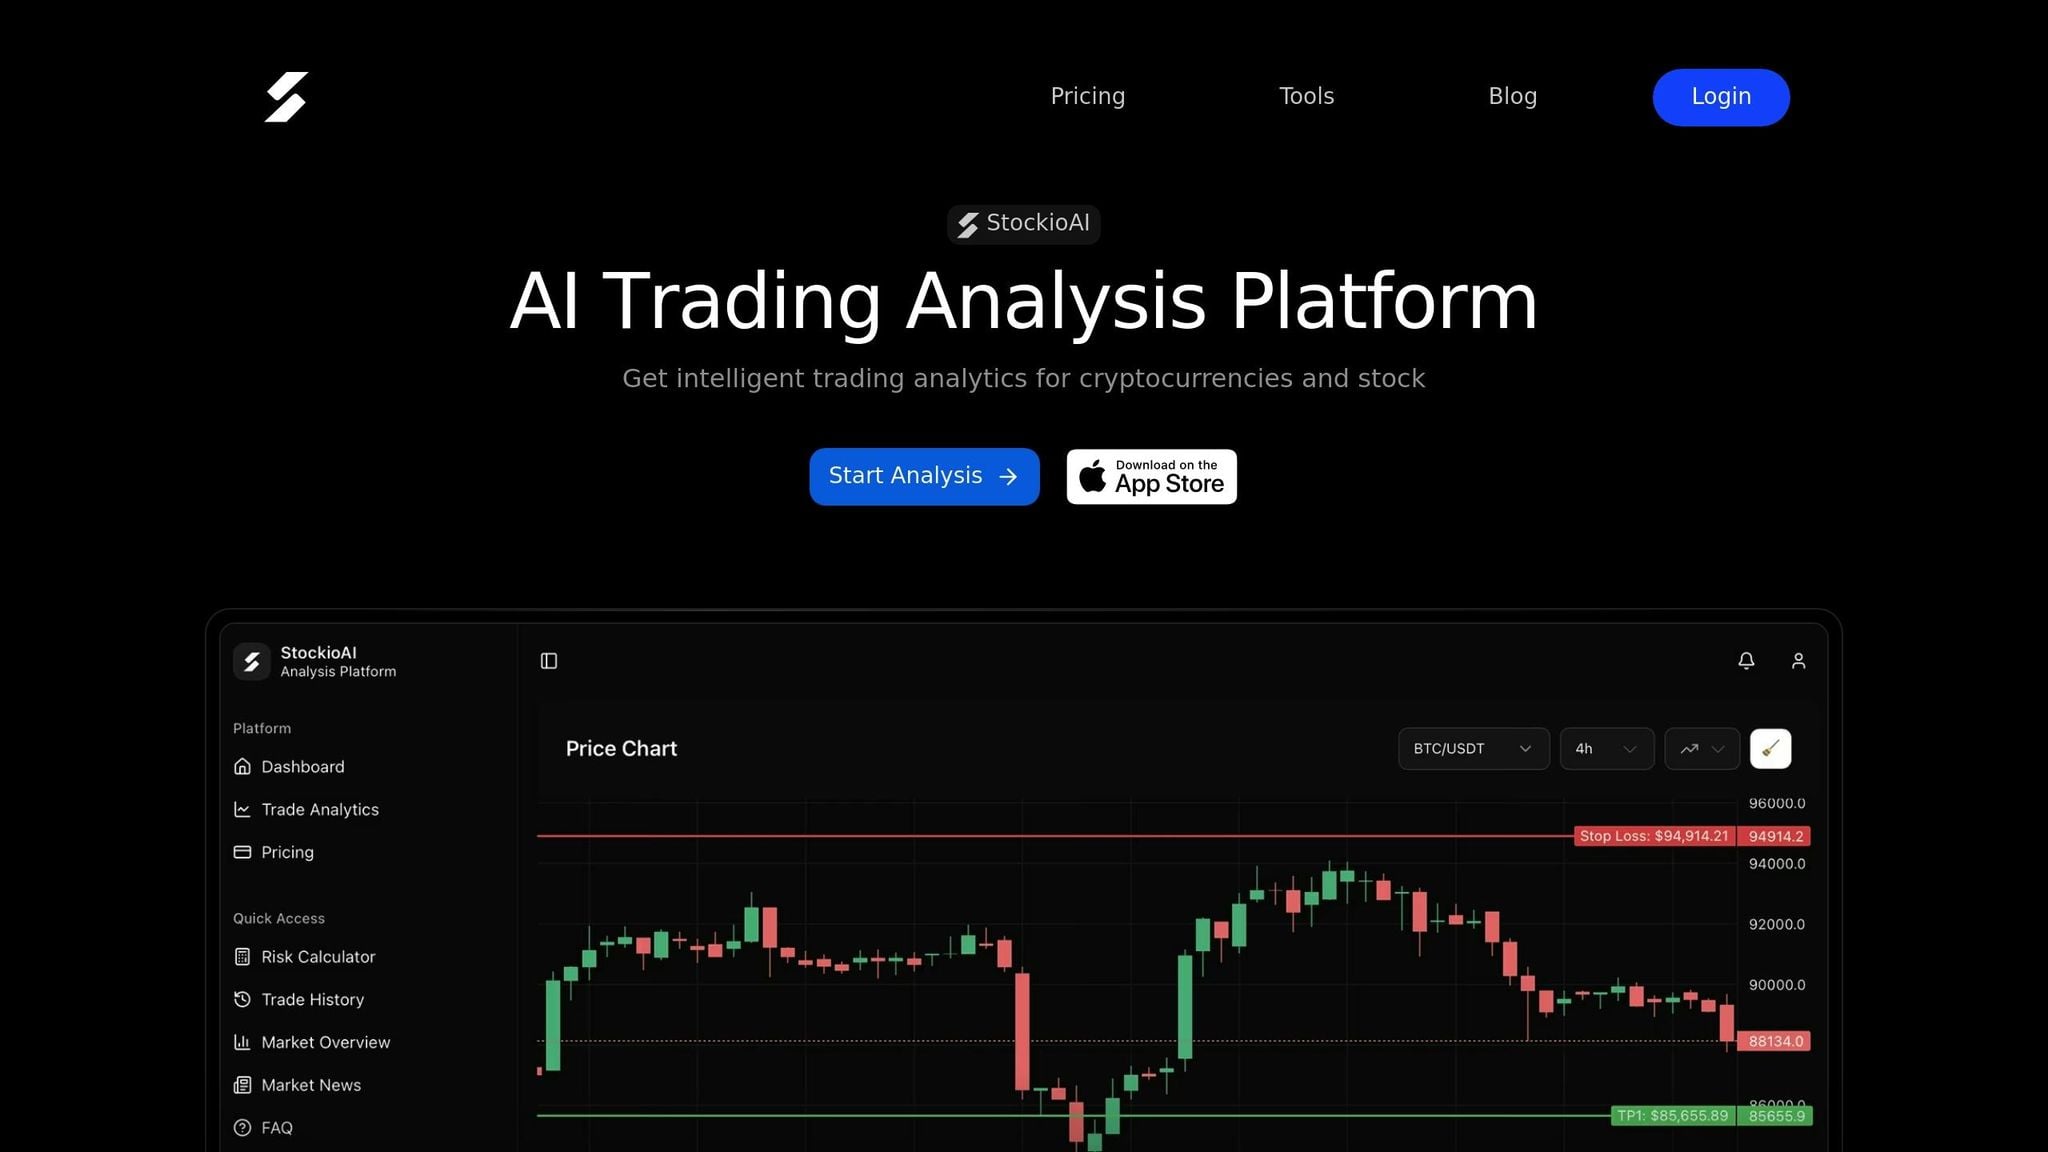
Analyzing chart patterns manually can be tedious and prone to mistakes, especially when markets are volatile. Enter AI-powered tools like StockioAI, which streamline this process and improve accuracy. With AI pattern scanners cutting manual charting time by 70% and reducing false signals by 40% [11], StockioAI takes the guesswork out of identifying key patterns. It scans multiple timeframes in real time, spotting high-probability setups like bull flags, head and shoulders, and triangles. Plus, it highlights critical levels - think necklines, support zones, and breakout points - directly on interactive charts.
StockioAI doesn’t stop at identifying patterns; it provides real-time trading signals with Buy, Sell, and Hold recommendations. When a pattern forms, the system evaluates factors like volume confirmation, trend alignment, and historical success rates to decide if the setup is worth acting on. For example, it knows that bull flags perform better in trending markets, while looser formations see reliability drop to 45% [20].
Another standout feature is its ability to classify market conditions - whether trending, ranging, volatile, or quiet. This allows traders to adapt their strategies based on whether they're in a bull or bear market. In bullish conditions, StockioAI highlights setups like flags and triangles, while in bearish markets, it focuses on bearish signals such as engulfing patterns. This context-aware approach ensures traders avoid patterns likely to underperform in specific environments.
Using AI to Identify High-Probability Patterns in Any Market
Not all chart patterns are created equal. Some are far more reliable than others. For instance, Cup and Handle patterns boast a 95% success rate on bullish breakouts, often leading to an average price increase of 54%. Similarly, Inverse Head and Shoulders patterns have an 89% success rate for trend reversals [20]. StockioAI filters patterns by their historical reliability, helping traders zero in on the setups with the best odds.
"Patterns don't predict direction - they quantify structural bias once price has already revealed intent." – Gabriel Amadeus Lau, Trader [13]
Confirmation is everything. StockioAI notifies traders when a pattern completes, such as a breakout above a neckline. It also checks for volume spikes - breakouts with volume 50% above average often confirm momentum [2]. This extra layer of analysis ensures that detected breakouts are backed by sufficient market activity, reducing the likelihood of chasing false signals.
In bull markets, traders are better off focusing on bullish continuation patterns like flags and pennants, which succeed about 67% of the time [11]. During bear markets, bearish reversal patterns like Bearish Engulfing are more effective, achieving a 79% reversal rate and hitting price targets 76% of the time in downtrends [19]. StockioAI automatically adjusts its recommendations based on the prevailing market trend, making it easier to align strategies with current conditions.
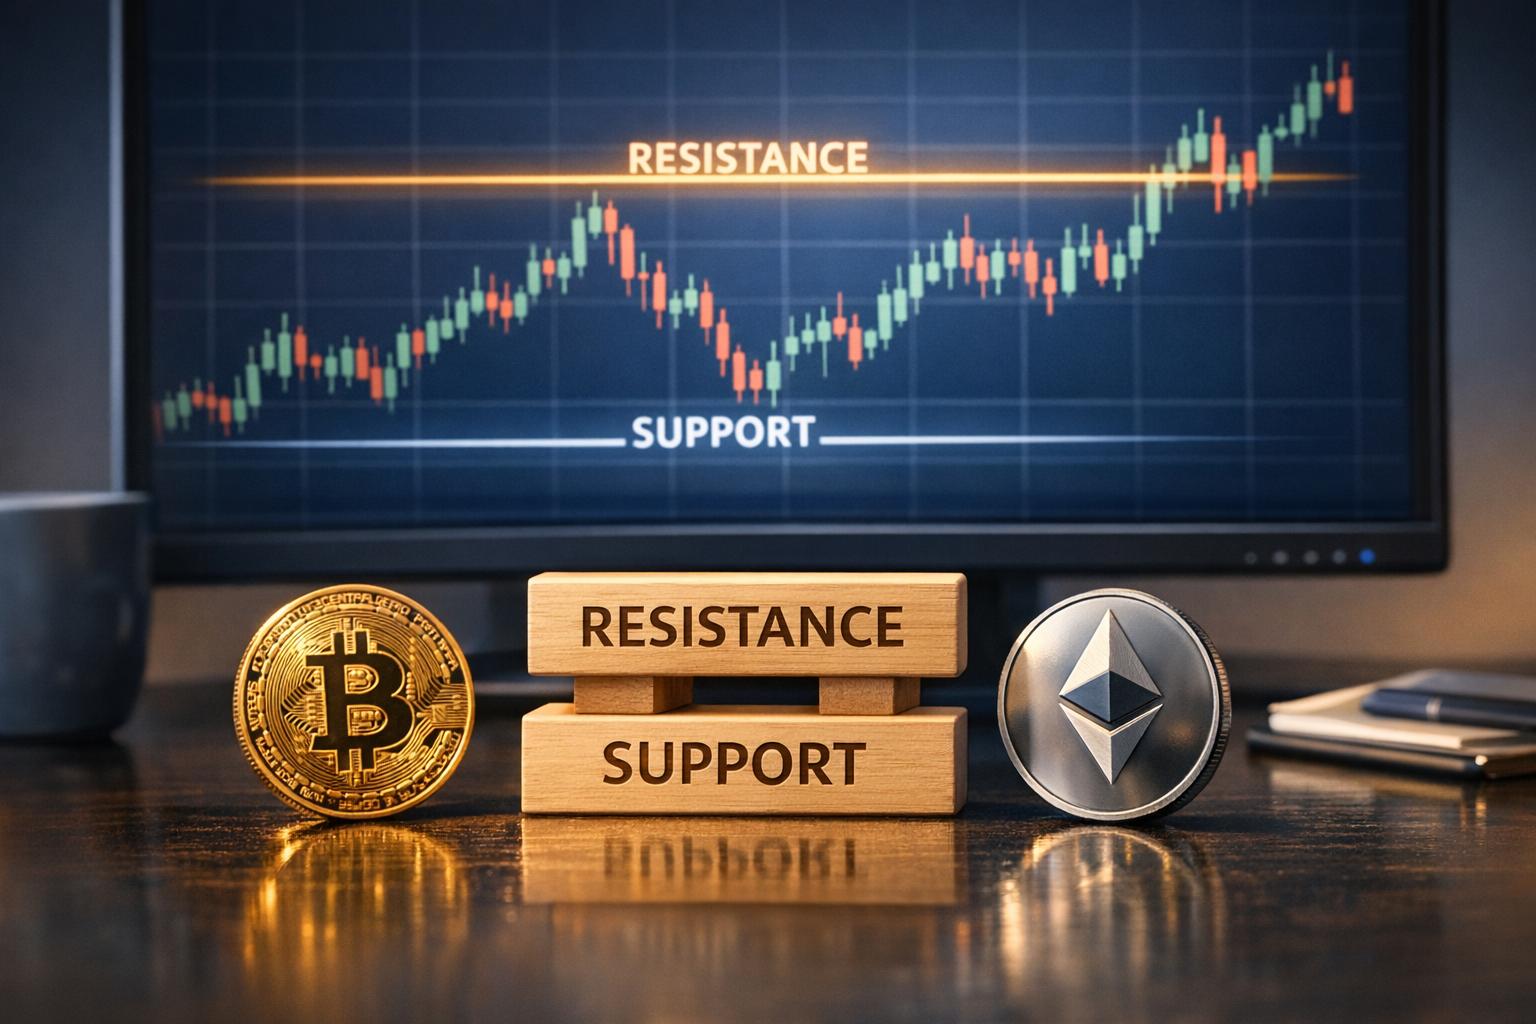
Risk Management in Bull and Bear Markets
Risk Management Strategies for Bull Markets
Managing risk effectively is the bridge between spotting chart patterns and turning them into actionable trades. Bull markets, while exciting, often hide rising risks. As stock prices soar, your portfolio can become unintentionally more aggressive - a phenomenon called portfolio drift. For instance, gains in equities might push your allocation from 75% to 85%, leaving you more vulnerable to a market downturn [5].
To counter this, regularly trim your winning positions and reallocate those gains into cash or fixed-income investments. This keeps your portfolio balanced and prevents it from becoming overly risky [5]. Another essential tool? Stop-loss orders. Placing these just below key support levels and limiting each trade to 1–2% of your capital can help you respond quickly to market shifts [11] [24]. These strategies align well with the nuanced approaches needed for interpreting dynamic chart patterns.
Risk Management Strategies for Bear Markets
Bear markets, on the other hand, are all about protecting your capital. They’re tough - lasting, on average, about 289 days (roughly 9.6 months) and wiping out around 35% of stock value [22]. Take the 2007–2009 financial crisis as an example: the S&P 500 plunged nearly 59% over 27 months [23]. Panic selling during these periods can turn temporary losses into permanent setbacks [21].
"The main risk that investors face during a bear market is panic, but even the most patient investors can be forced to sell at bear market prices if they are living off of their portfolios."
One way to avoid this trap is by setting up a liquidity strategy. Keeping cash and short-term bonds on hand ensures you can cover your expenses without selling long-term investments during a downturn [21]. Additionally, tax-loss harvesting during market sell-offs could boost your after-tax returns by about 0.5% annually [21], turning market challenges into small opportunities.
Another smart move? Use dollar-cost averaging to gradually buy discounted shares, reducing the risk of mistiming the market [23]. Interestingly, about 42% of the S&P 500's strongest days over the last 20 years occurred during bear markets [22]. This highlights the importance of staying invested, even when it feels counterintuitive.
| Strategy Component | Bull Market Approach | Bear Market Approach |
|---|---|---|
| Primary Goal | Manage portfolio drift and avoid overexposure [5] | Protect capital and ensure liquidity [21] |
| Position Sizing | Trim winners to maintain target allocation [5] | Use dollar-cost averaging to buy discounted shares [23] |
| Stop-Loss Placement | Below key support levels or pattern lows [24] | Above resistance to guard against short-term rallies [4] |
| Cash Management | Rebalance into cash or fixed income [5] | Hold cash/bonds for essential expenses [21] |
| Sector Focus | Growth sectors like tech and consumer goods [25] | Defensive sectors such as utilities and healthcare [25] |
ULTIMATE Bull Flag And Bear Flag Pattern Trading Strategy (Experts Only)
Conclusion
Chart patterns reveal the ongoing tug-of-war between buyers and sellers, providing traders with a visual roadmap of market sentiment [26]. Recognizing how these patterns behave in bull versus bear markets can be the difference between riding a profitable trend or falling victim to a false breakouts. The numbers don't lie: bullish continuation patterns succeed about 67% of the time, while bearish patterns hit their targets approximately 64% of the time [11].
However, these success rates aren't guaranteed without proper confirmation methods. To maximize reliability, traders should look for a 50% volume spike alongside disciplined stop-loss limits (1–2% of capital). These safeguards are essential for protecting against the occasional failure of even high-probability patterns [2][3][11]. For example, the Inverse Head and Shoulders pattern boasts an impressive 89% success rate, but it can still lead to losses if risk controls aren't in place [3].
Technology has added another layer of precision to trading. AI-powered tools, such as StockioAI, now make chart analysis more efficient by offering real-time pattern recognition and automated insights. These advancements allow traders to adapt more seamlessly to shifting market conditions, whether navigating the steady climb of a bull market or the unpredictable swings of a bear market.
The key to consistent trading lies in combining market context, advanced AI tools, and disciplined risk management. Understanding the broader market environment is crucial. For instance, a rising wedge might signal caution during a bull market, but in a bear market, it becomes a valuable tool for timing breakdowns rather than rallies [4]. As Arthur Hill, CMT, aptly explains:
"The rising wedge is your friend in a bear market. It is not used to play the advance, but rather to time a breakdown and continuation of the bigger downtrend" [4].
FAQs
How do chart patterns behave differently in bull and bear markets?
Chart patterns often shift based on the market's overall direction, meaning their characteristics and interpretations vary between bull and bear markets. In a bull market, you’ll often see bullish continuation patterns like ascending triangles, flags, and pennants. These patterns typically feature higher lows and breakouts to the upside, often confirmed by a noticeable increase in trading volume. On the flip side, in a bear market, bearish continuation patterns such as descending triangles, flags, and pennants emerge. These show lower highs and downward breakouts, which are also accompanied by rising volume.
Reversal patterns behave differently depending on the market trend as well. Take the bullish engulfing candle, for example - this occurs when a green candle completely engulfs a prior red candle, signaling a potential upward reversal after a downtrend. Meanwhile, a bearish engulfing candle, where a red candle swallows up a green one, suggests a possible downward reversal following an uptrend.
Being able to spot these patterns allows traders to fine-tune their strategies, including adjusting entry points, setting stop-loss levels, and defining profit targets. Tools like StockioAI’s AI-powered pattern recognition can be incredibly helpful, identifying these formations in real time and giving traders the insights they need to navigate the current market conditions effectively.
How does trading volume confirm chart patterns?
Trading volume is a key factor in confirming chart patterns, as it reveals the level of market activity driving price changes. For instance, when a bullish or bearish reversal pattern emerges, a noticeable spike in volume signals that traders are actively pushing the price in the anticipated direction. Without this increase, the pattern might lack credibility and could lead to a misleading signal.
In continuation patterns like flags, pennants, or triangles, a breakout accompanied by a surge in volume often indicates strong momentum, suggesting the trend is likely to continue. Many traders watch for volume levels that are 1.5 to 2 times higher than the recent daily average as a reliable confirmation signal.
StockioAI streamlines this process by leveraging AI-driven tools to automatically detect chart patterns and overlay real-time volume data. This allows traders to quickly pinpoint strong setups and steer clear of weaker, less dependable signals.
How can AI tools like StockioAI simplify chart pattern analysis in bull and bear markets?
AI platforms like StockioAI simplify and speed up the process of identifying chart patterns by analyzing price movements in real time. Instead of manually scanning charts, the platform automatically detects key formations such as head-and-shoulders, triangles, and double tops. It also provides probability-based signals to help traders decide whether to buy, sell, or hold. This automation reduces the chance of overlooking important patterns, particularly in fast-paced market conditions.
But StockioAI doesn’t stop at pattern detection. It includes features like risk-reward calculators and real-time market news integration, which help traders gauge how events like earnings reports or economic updates could influence a pattern’s reliability. With interactive charts and historical back-testing tools, users can fine-tune their strategies and respond quickly, whether the market is trending up or down. By automating much of the analysis, StockioAI enables traders to concentrate on executing their strategies rather than spending time manually interpreting charts.