Trendline breakouts can help traders identify shifts in market trends and pinpoint entry and exit opportunities. Here's what you need to know:
- Trendlines: These are straight lines connecting key highs in a downtrend or lows in an uptrend, acting as support or resistance levels. The more times a price touches a trendline without breaking, the stronger it becomes.
- Breakouts: A breakout occurs when the price moves decisively beyond a trendline, signaling a potential trend reversal or continuation.
- Challenges: False breakouts, caused by temporary price moves or market noise, can lead to losses. Tools like volume analysis and multi-timeframe views can help confirm genuine breakouts.
- Strategies: Techniques like the break-and-retest method, combined with stop-loss placement and risk-reward management, improve trading outcomes.
- AI Tools: Platforms such as StockioAI analyze real-time data to identify breakout opportunities, provide precise entry/exit points, and reduce false signals.
Breakout trading requires discipline, confirmation signals, and risk management to avoid common pitfalls like acting on false signals or overfitting trendlines.
How To Stop Fakeouts With Trendlines
Common Problems in Identifying Real Breakouts
Traders often face challenges in telling apart genuine breakouts from temporary price moves. The difficulty lies in recognizing meaningful price shifts while avoiding the trap of short-term fluctuations that can lead to losses.
False Breakouts and Market Noise
False breakouts happen when the price briefly crosses a trendline but quickly reverses, often leaving traders with losses. These misleading moves are common and can be triggered by random market fluctuations, low liquidity, or sudden news events that cause quick price spikes.
Market noise - those unpredictable, short-lived price movements - is a major factor behind false breakouts. For example, during low-volume trading or highly volatile conditions, a single large order or algorithmic trading activity can push prices beyond key levels without any real change in market sentiment. This results in temporary price spikes that quickly reverse, catching traders off guard.
Take major news releases as an example. Prices may surge, breaking established trendlines, but if the overall market sentiment remains unchanged, the breakout often fails. Traders who jump in during that initial surge often find themselves holding positions that quickly turn against them.
The psychological toll of false breakouts can be just as damaging as the financial losses. After experiencing false signals, traders may hesitate to act on future opportunities, even when the setups are legitimate. This hesitation creates a cycle of missed chances and frustration.
To combat this, incorporating tools like volume analysis and multi-timeframe views can help traders better identify genuine moves.
Volume Analysis and Multi-Timeframe Confirmation
Volume and timeframe analysis are key in separating real breakouts from noise. Volume spikes are one of the most reliable indicators of a genuine breakout. When a breakout is accompanied by a noticeable increase in trading volume, it reflects strong market participation and conviction. On the other hand, breakouts with flat or minimal volume often lack the support needed for sustained movement.
The difference between failed and successful breakouts becomes clearer when examining volume. For instance, in a GBP/USD trade, an initial breakout on a 15-minute chart failed due to low volume. However, a second breakout, supported by higher volume and momentum indicators, led to a profitable trade[4].
Multi-timeframe analysis adds another layer of context. By looking at higher timeframes, such as daily or weekly charts, traders can identify the broader trend and determine if a lower timeframe breakout aligns with it. For example, a breakout on a 15-minute chart is more likely to succeed if it moves in the same direction as the trend on a daily chart.
Platforms like StockioAI integrate multi-timeframe insights into their analysis. By processing over 60 real-time data points, including volume patterns and technical indicators, the platform helps filter out market noise and provides a clearer picture of breakout potential[1]. This approach ensures traders don’t rely solely on signals from a single timeframe, improving decision-making.
This leads to the importance of confirmation signals in solidifying breakout strategies.
The Role of Confirmation Signals
Waiting for confirmation signals is a critical step in breakout trading. Instead of acting immediately on a breakout, experienced traders look for signs that validate the move. One of the most effective methods is the break and retest strategy.
Here’s how it works: after a breakout, traders wait for the price to retest the broken level. If the retest holds - meaning the previous resistance turns into support (or vice versa for downward breakouts) - it confirms the breakout. Candlestick patterns, such as pin bars or engulfing candles, alongside momentum indicators, can further validate the move.
The concept of confluence is essential here. When multiple factors align - such as a volume increase, a successful retest, supportive candlestick patterns, and momentum indicator agreement - the likelihood of a successful trade increases significantly. AI-powered tools like StockioAI excel at identifying these confluence points. By using pattern recognition, these platforms provide traders with detailed insights, including entry points, stop-loss levels, and profit targets, along with confidence scores[1].
For modern traders, technology has become a game-changer. Platforms like StockioAI can process confirmation signals faster and more accurately than manual analysis. With a reported 75% win rate across 35 closed trades and a profit factor of 2.95[1], these AI-driven tools are proving to be highly effective in spotting real breakout opportunities while helping traders avoid false signals.
Proven Strategies for Trading Trendline Breakouts
Trading trendline breakouts successfully requires a well-thought-out plan that blends precise trendline drawing, smart entry techniques, and modern technology. These methods help traders seize real breakout opportunities while steering clear of false signals.
Drawing Accurate Trendlines
The foundation of breakout trading lies in drawing accurate trendlines. A valid trendline connects at least two swing highs for a downtrend or two swing lows for an uptrend, but having three or more touchpoints makes it even more reliable [2][3][5]. To reduce short-term noise, focus on trendlines with at least three clear touchpoints over a week-long period on a 4-hour chart [3]. Instead of forcing lines to fit minor price movements, connect the most prominent swing points.
Experienced traders emphasize working with well-defined trendlines that have multiple touchpoints and consistent confirmation signals [3]. Each additional test of a trendline strengthens its significance, making a breakout more meaningful and increasing the chances of a sustained price move [2]. Using these reliable trendlines, traders can apply strategies like the break and retest method to validate their entries further.
Break and Retest Strategy
The break and retest approach is a trusted method for trading trendline breakouts. This strategy involves waiting for the price to break a trendline, followed by a retest of the broken level as new support or resistance. After the breakout, many traders look for the price to pull back and test the trendline. If the retest holds - signaling that previous resistance has turned into support (or vice versa) - it confirms the breakout's strength.
For example, on a GBP/USD hourly chart, an initial breakout may fail, but a successful retest validated by a bullish pin bar and a MACD crossover can provide a high-probability entry with a 2:1 risk-reward ratio [4].
Stop-loss orders should be placed just beyond the latest swing high for short trades or swing low for long trades [3][5]. It's essential to manage risk by ensuring potential losses don’t exceed 1–2% of your trading account. Profit targets can be set using Fibonacci extension levels, such as the 161% inverse Fibonacci level, which often serves as a realistic exit point. Trailing stops can also help secure profits as the trade moves in your favor [5]. Incorporating AI tools into this strategy can further refine the process.
Using AI Tools Like StockioAI
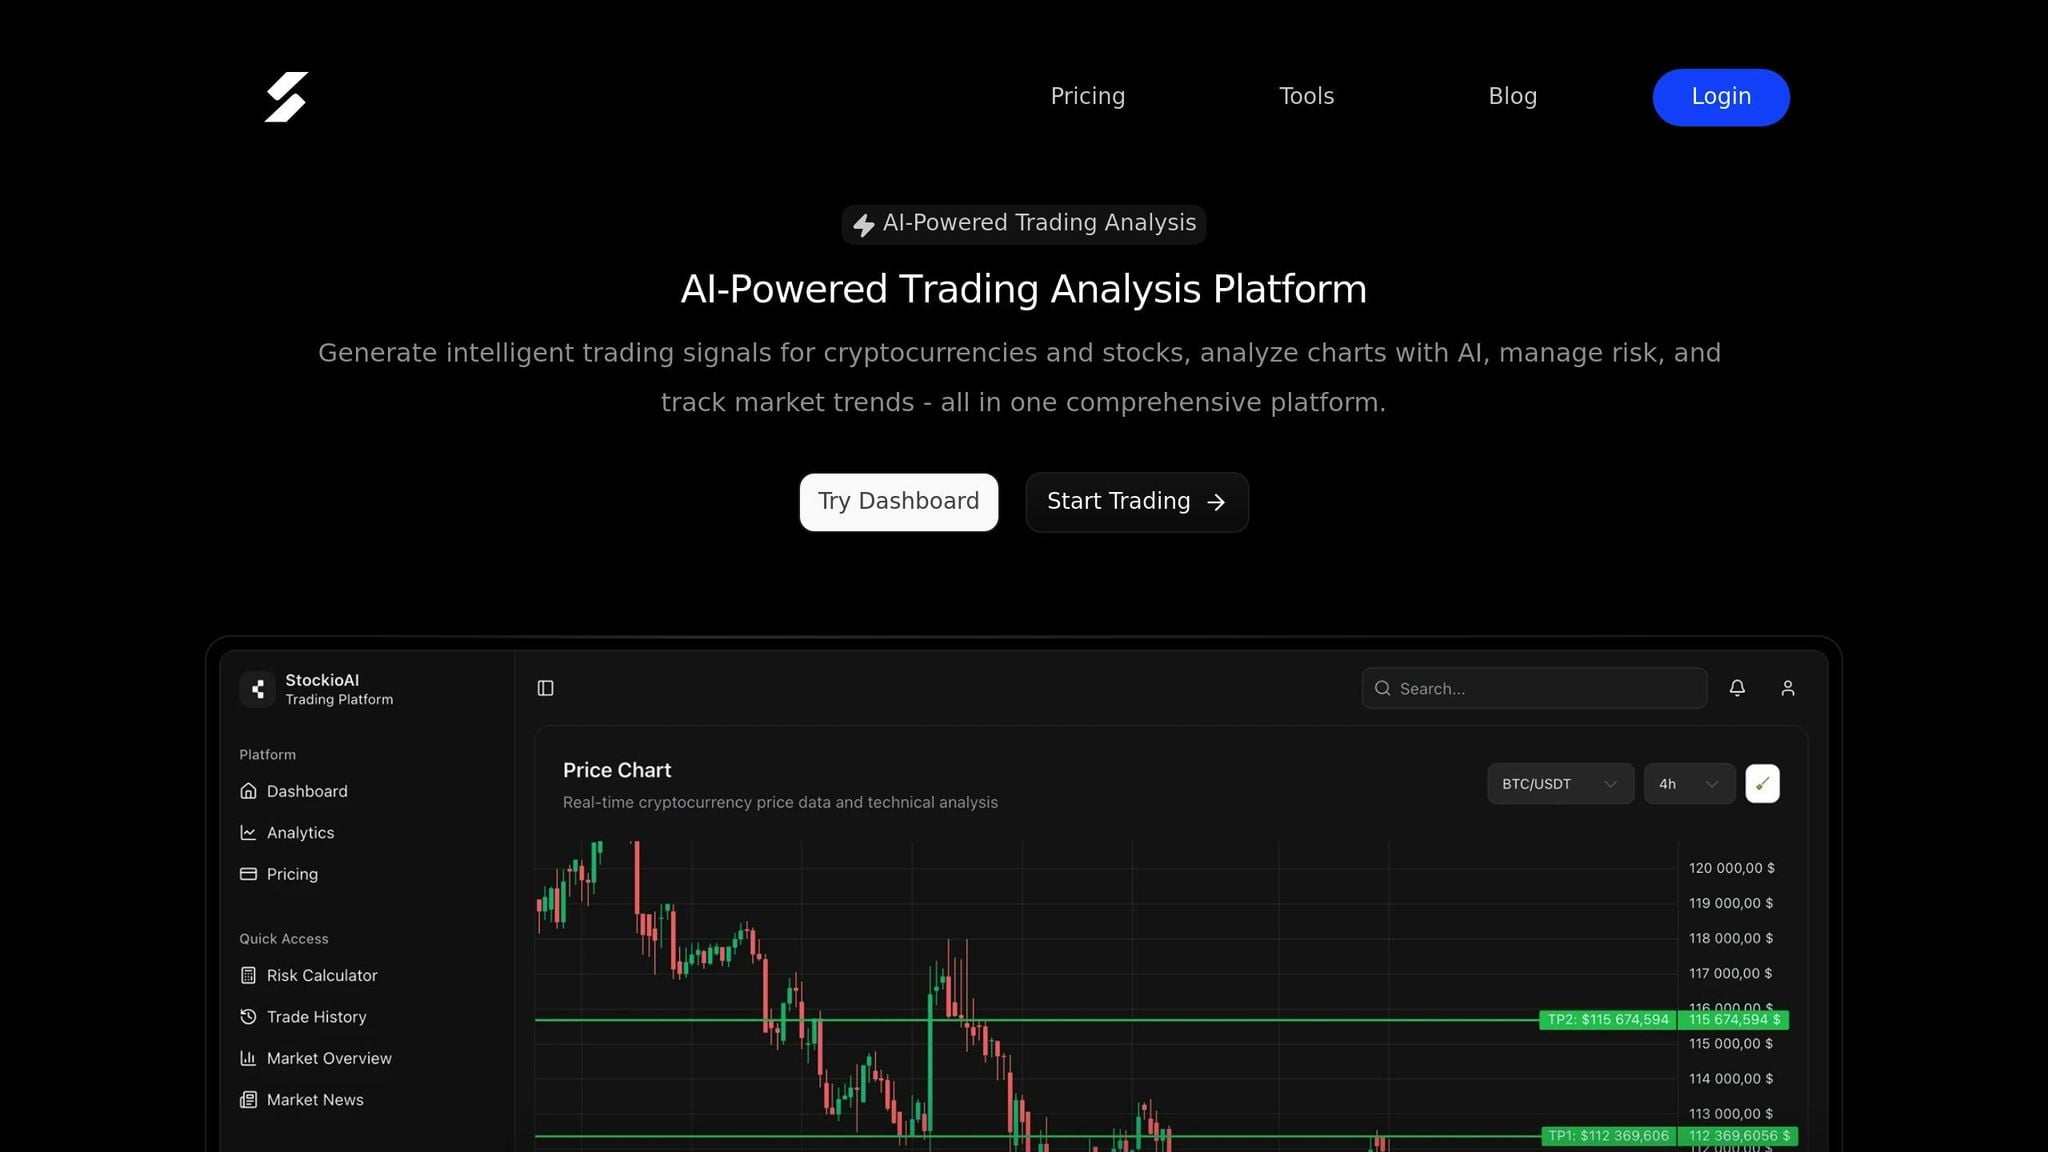
AI-driven platforms have revolutionized breakout trading by offering real-time analysis and signal generation. StockioAI, for instance, processes over 60 real-time data points per second, including technical indicators, volume trends, support and resistance levels, and market sentiment, to identify breakout opportunities [1]. Its advanced machine-learning algorithms automatically detect chart patterns, trend reversals, and optimal entry and exit points, reducing the guesswork involved in manual analysis [1].
StockioAI provides clear BUY, SELL, and HOLD recommendations, complete with entry points, stop-loss levels, and profit targets, all backed by a confidence score [1]. These AI insights have helped traders achieve consistent results [1].
The platform also offers interactive chart analysis, displaying AI-generated trading levels, support/resistance zones, and technical indicators directly on the charts. This visual aid simplifies identifying potential breakouts [1]. Additionally, its multi-timeframe analysis validates breakout signals across different time horizons, reducing false signals and improving accuracy. The built-in risk calculator helps traders determine position sizes and set effective stop-loss levels, ensuring disciplined risk management. With a reported 75% win rate, StockioAI highlights how AI tools can enhance traditional breakout strategies [1].
Confirmation and Risk Management Methods
Once you've identified a breakout, the next step is to confirm its validity and manage your risk effectively. These steps are essential for protecting your capital and increasing the likelihood of successful trades.
Key Confirmation Tools
Using confirmation tools can help determine whether a breakout is genuine or likely to fail. Here are some of the most effective methods:
-
Volume analysis: A spike in trading volume often signals that a breakout has real momentum behind it. Without this surge, the breakout may not hold up over time [4].
-
Candlestick patterns: Visual signals from candlesticks can confirm breakouts. For instance, a bullish engulfing pattern supports an upward breakout, while a bearish engulfing pattern aligns with a move downward [4].
-
Oscillators like RSI and MACD: These indicators can provide additional confirmation. For example, if EUR/USD breaks a trendline and the MACD shows bearish momentum, it reinforces the case for shorting the pair [2].
-
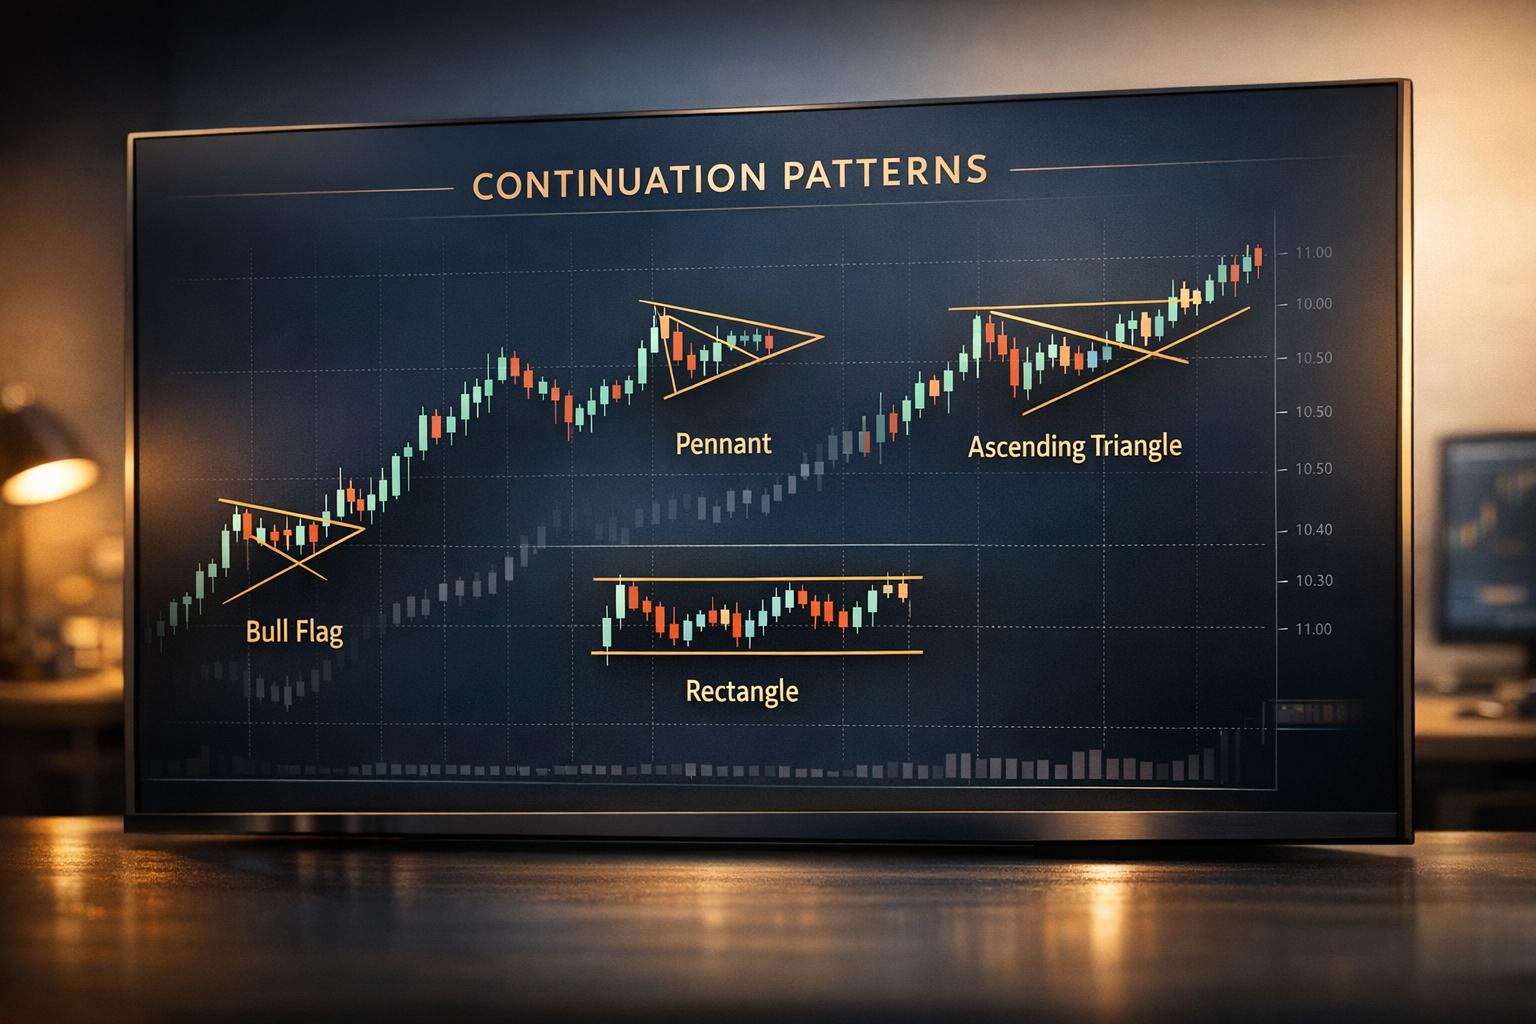
Chart patterns: Patterns like flags, triangles, or pennants that coincide with trendline breaks give extra validation to a breakout [4].
-
Fibonacci retracement and extension levels: When price breaks a key Fibonacci level after crossing a trendline, it strengthens the case for the new trend [4].
By combining these tools, traders can confirm breakouts with greater confidence and set the stage for disciplined risk management.
Setting Stop-Losses and Managing Risk
Managing risk starts with placing stop-loss orders in strategic positions to protect against reversals while allowing room for potential gains.
- For upside breakouts (downtrend line breaks), position the stop loss just below the retest level after the breakout is confirmed.
- For downside breakouts (uptrend line breaks), place the stop loss above the most recent swing high [4][5].
The logic here is simple: stops should be placed just beyond the retest level, which acts as a validation point where former resistance becomes support, or vice versa. For example, if a bullish pin bar forms during a trendline retest, the stop loss should be set below both the pin bar and the trendline [4].
Position sizing is equally important. Calculate your position size based on the distance between your entry point and stop-loss level, ensuring you risk only 1-2% of your total capital per trade [4].
Risk-reward ratios are another key consideration. Aim for a ratio of at least 2:1 or 3:1. For instance, if you're risking $100, your target profit should be $200-$300 to make the trade worthwhile [4].
StockioAI simplifies this process with its built-in risk calculator, which automatically determines optimal position sizes and stop-loss levels. It analyzes over 60 real-time data points - like technical indicators, volume patterns, and market sentiment - to generate trading signals with precise entry and exit points [1].
"Each position includes detailed reasoning, clear entry points, stop-loss levels, and profit targets with confidence scores, helping you make informed decisions in volatile crypto markets." - StockioAI [1]
These tools and strategies work together to minimize losses while maximizing potential gains.
Multi-Timeframe Analysis for Stronger Signals
Multi-timeframe analysis is a powerful way to strengthen breakout signals by aligning trends across different time periods. Here's how it works:
- Higher timeframes (daily or weekly charts): These provide the big-picture trend direction, offering context for breakouts seen on shorter timeframes [4].
- Lower timeframes (hourly or 15-minute charts): Use these for pinpointing entry and exit points with greater precision.
The goal is to find confluence between timeframes. For example, if a trendline break appears on a 15-minute chart, check whether the same breakout pattern is visible on hourly or 4-hour charts. When multiple timeframes align, the breakout signal becomes far more reliable, reducing the risk of false entries [4].
This layered approach helps traders avoid the pitfalls of acting on isolated signals from a single timeframe, which often lead to premature trades and unnecessary losses. By combining confirmation tools, disciplined risk management, and multi-timeframe analysis, you can significantly improve your trading outcomes.
Common Mistakes in Trendline Breakout Trading
Mistakes in trendline breakout trading can quickly turn a promising opportunity into a setback. The good news? Most of these errors are completely avoidable once you’re aware of them.
Entering Trades Without Confirmation
One major misstep is jumping into a trade the moment a trendline breaks. This kind of impulsive decision often leads to losses, especially if the breakout turns out to be false and the price reverses direction.
Instead of rushing in, wait for confirmation. For example, look for a retest of the broken trendline, check for candlestick patterns that indicate bullish or bearish momentum, or confirm the breakout with increased trading volume or indicators like RSI or MACD [4]. These steps can help you avoid getting trapped in a losing position.
Tools like StockioAI can also play a key role here. Its data-driven analysis provides clear trading signals and risk management insights, helping traders steer clear of premature entries [1].
Overfitting Trendlines
Another common error is overfitting trendlines - adjusting them to match every small price movement. While it might make the trendline look "perfect", it often leads to unreliable signals because the line no longer reflects the true market structure.
Overfitting happens when traders connect too many insignificant points or tweak trendlines excessively to fit minor fluctuations. The result? A trendline that’s more misleading than helpful [4][2].
To avoid this, focus on connecting at least two, ideally three or more, significant swing highs or lows. Resist the urge to adjust the trendline for every minor price move; the most reliable trendlines naturally align with major turning points. Remember, the more you force it, the less effective it becomes [6][2].
StockioAI’s AI-powered pattern recognition can help eliminate this bias by providing objective, data-driven trendline analysis [1].
Ignoring Market Context
Failing to consider the broader market context is another mistake that can lead to poor decisions. Factors like the overall trend, momentum, volatility, and nearby support or resistance levels all influence whether a breakout is likely to succeed.
For instance, a breakout that goes against the prevailing trend or happens during low-volume periods is far less likely to hold. Similarly, trading a minor trendline break near a major resistance level often ends in disappointment.
To make better decisions, always analyze the bigger picture. Use higher timeframes to identify the primary trend, incorporate multi-timeframe analysis for added clarity, and account for factors like economic news and market sentiment. A breakout that aligns with the broader market conditions has a much higher chance of success.
StockioAI simplifies this process by integrating market context into its analysis, offering traders a well-rounded view to make informed decisions [1].
Conclusion
Breakout trading becomes a powerful tool when technical knowledge meets disciplined execution. This section pulls together the core strategies and risk management techniques discussed earlier. While breakouts can signal trend shifts, relying on confirmed signals is key to avoiding unnecessary risks.
Key Points Summary
Effective breakout trading starts with strong trendlines and dependable confirmation methods. Instead of jumping into trades too quickly, look for additional signals like robust candlestick patterns, significant volume surges, or clear break-and-retest setups. These steps help minimize the chances of falling for false breakouts [4].
Using multi-timeframe analysis can also improve the odds of success, as aligning breakouts across different timeframes provides stronger validation. These methods work hand-in-hand with earlier discussions on confirmation techniques and risk management, creating a well-rounded approach to trading.
When setting stop-loss levels, place them just beyond the retest point to safeguard your capital. For profit-taking, consider splitting targets: one at the start of the trendline and another at the 161% inverse Fibonacci level [5]. Additionally, stay mindful of broader market conditions, economic updates, and nearby key levels. Remember, former support or resistance zones often flip roles after a breakout [4].
Using StockioAI for Better Results
To enhance your breakout trading, modern tools like StockioAI can make a difference. The platform analyzes over 60 real-time data points per second, helping to identify authentic breakout opportunities while filtering out false signals [1].
StockioAI’s advanced pattern recognition eliminates bias, ensuring cleaner and more reliable trendlines. With a reported 75.0% win rate and a 2.95 profit factor based on 35 closed trades [1], it’s clear how AI can improve trading performance.
The platform also simplifies risk management by calculating optimal position sizes, stop-loss levels, and leverage for each trade [1]. It provides precise entry and exit points, complete with detailed reasoning, stop-loss placements, and profit targets - all backed by confidence scores for each signal [1].
FAQs
How can traders tell the difference between a real breakout and a false one?
To tell the difference between a genuine breakout and a false breakout, traders should watch for specific confirmation signals. One key indicator is trading volume - if the breakout is accompanied by higher-than-average volume, it often reflects stronger confidence behind the price movement. Another important factor is whether the price consistently closes above or below the trendline across multiple timeframes, which can strengthen the case for a valid breakout.
At the same time, caution is critical. Implementing risk management strategies like setting stop-loss orders can help safeguard against unexpected losses. Tools such as StockioAI can be incredibly helpful here, offering real-time trading signals and AI-driven pattern recognition to guide better decision-making, even in unpredictable market conditions.
How does volume analysis help confirm trendline breakouts?
Volume analysis is key when it comes to confirming trendline breakouts. A breakout paired with high trading volume is generally seen as more trustworthy because it reflects strong market interest and momentum driving the move. On the flip side, breakouts that occur with low volume might indicate weaker conviction, which could increase the likelihood of a false breakout.
By studying volume patterns, traders can gauge the strength of a breakout more effectively and determine whether it’s a good opportunity to act or better to hold back. Tools like StockioAI can be incredibly useful here, offering real-time volume data and pattern recognition to help traders make smarter, more confident decisions.
How can AI tools like StockioAI improve the effectiveness of breakout trading strategies?
AI tools such as StockioAI enhance breakout trading by combining advanced analytics with real-time data. They excel in detecting critical trendline breakouts, delivering precise buy and sell signals, and identifying the best entry and exit points for trades.
On top of that, features like AI-driven pattern recognition and risk management systems empower traders to make smarter decisions. By minimizing guesswork, these tools improve trading strategies and offer a steady hand in the often unpredictable and fast-moving financial markets.