If you're trading cryptocurrencies, understanding support and resistance levels is crucial. These price zones help you identify where buying or selling pressure might cause the price to reverse or stall. Here's the breakdown:
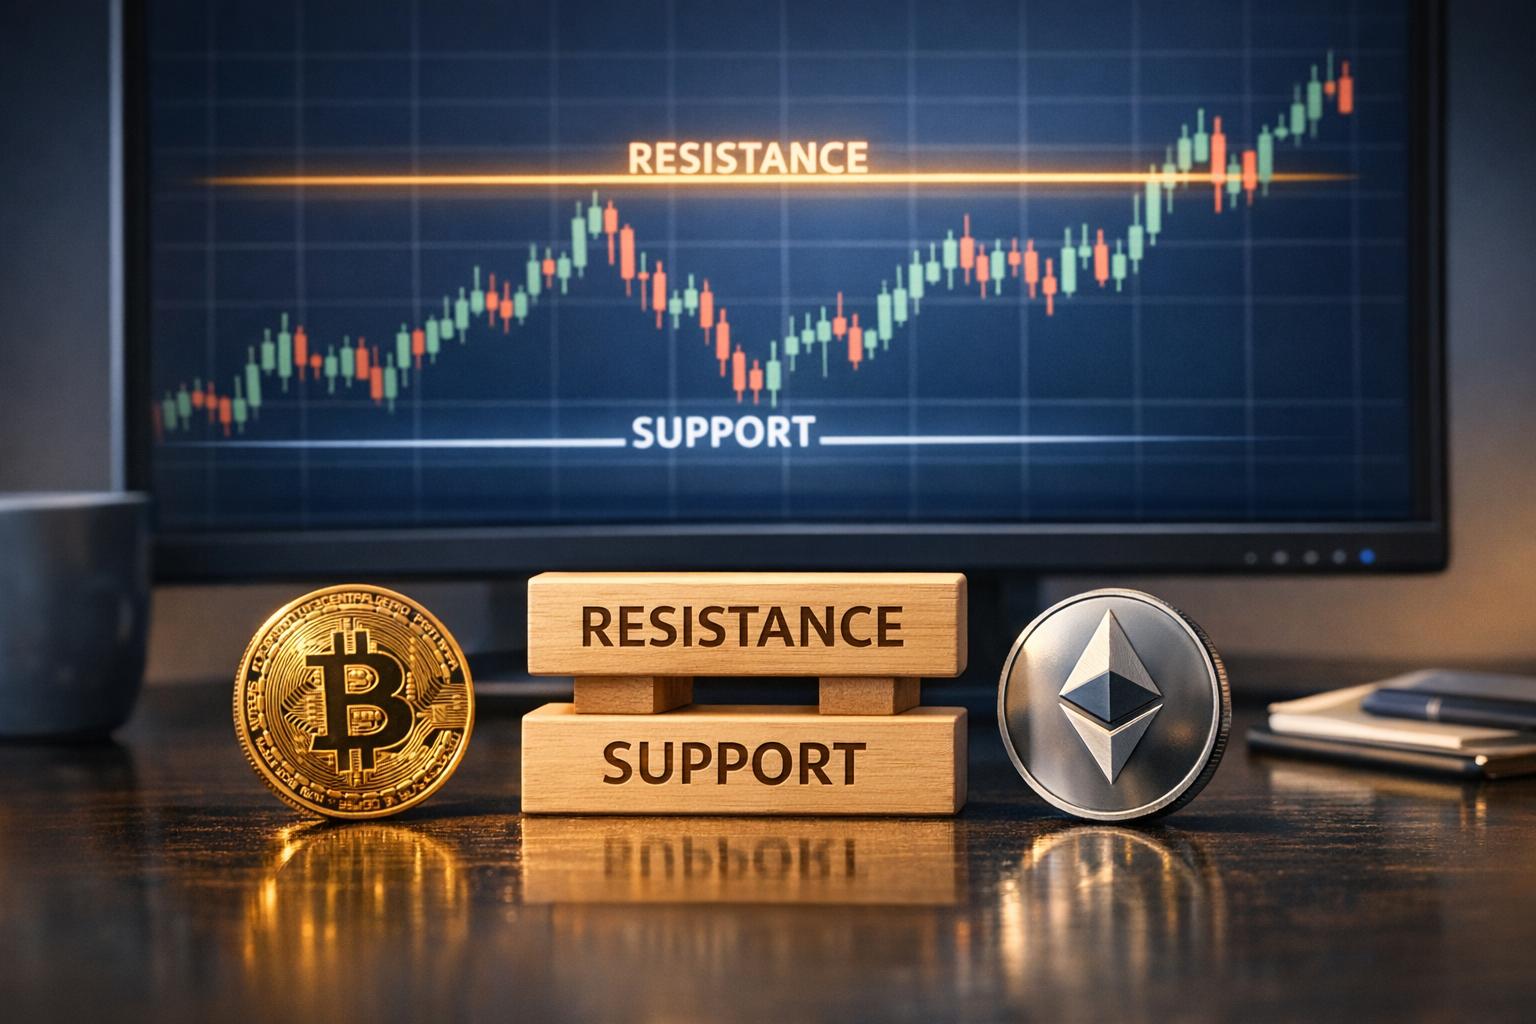
- Support: A price level where demand increases, stopping a downward trend.
- Resistance: A price level where selling intensifies, halting an upward trend.
- Key Concept: Once broken, support often becomes resistance, and vice versa.
These levels aren't exact numbers but zones influenced by trader psychology, historical price patterns, and market activity. Tools like moving averages, trendlines, and volume analysis can refine your understanding of these zones.
Why They Matter:
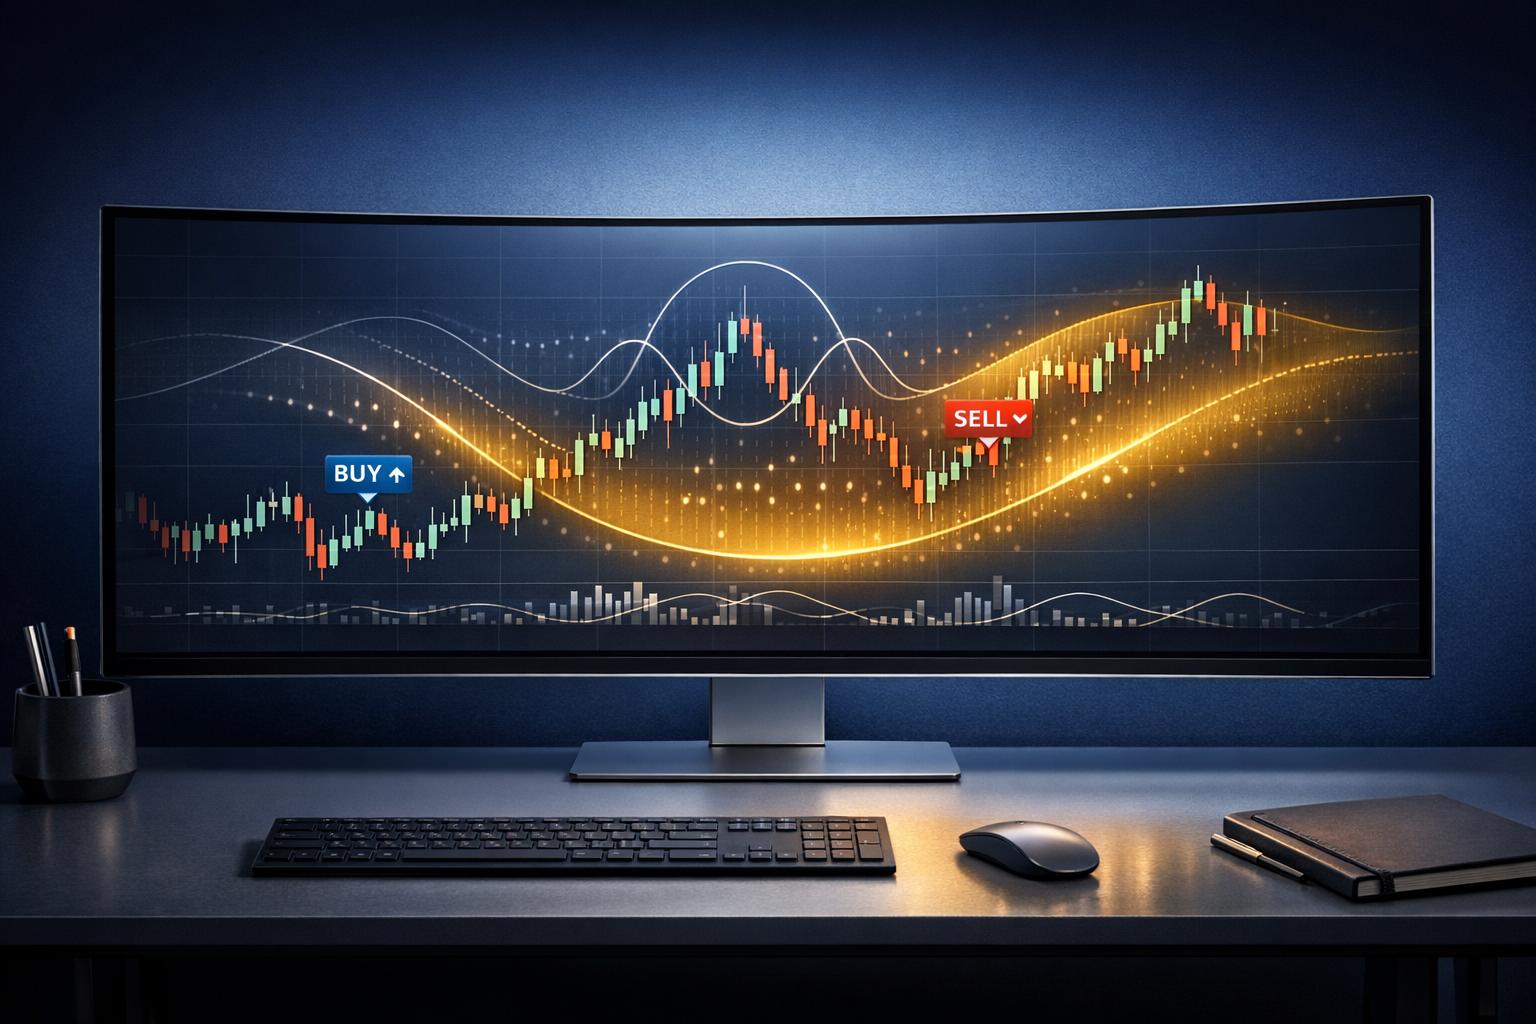
- Traders use them for entry and exit points.
- Help manage risks with stop-loss and take-profit orders.
- Indicate potential reversals or breakouts.
To simplify analysis, tools like StockioAI automate the detection of these levels and provide actionable trading signals, reducing guesswork and saving time. Whether you're range trading, targeting bounces, or looking for breakouts, mastering support and resistance improves your trading decisions.
Support and Resistance Levels in Crypto Trading – Beginners Guide
How to Identify Support and Resistance Levels
Spotting support and resistance levels involves digging into historical price data. These levels reflect recurring patterns where price tends to reverse or pause, offering valuable insights for traders [3]. Here's how you can identify them on your charts.
Analyzing Historical Price Charts
Start by examining your chart for noticeable peaks and valleys - these are the points where the price has previously reversed or stalled [6]. These spots highlight where supply and demand balanced out in the past. For example, if a cryptocurrency repeatedly tests a specific price level before finally breaking through, that level is a key support zone.
Instead of treating these as exact numbers, think of them as zones. Prices rarely stop at an exact value, so it’s better to draw horizontal areas that capture a range where prices tend to cluster. Look for regions with repeated long wicks or reversal patterns. To get a clearer picture, use about six months of data for short-term trends and 12–18 months for long-term trends [6].
Another important concept is the support-resistance flip. When a resistance level is broken, it often turns into a new support level upon retesting [4]. This flip can help traders refine their strategies and adapt to market changes.
Psychological Price Levels
Round numbers often play a significant role in price action. For instance, in Bitcoin's history, key psychological levels have appeared at round figures like $1, $100, $1,000, and just below its peak near $70,000 [8]. These levels attract attention because traders tend to focus their buy and sell orders around these numbers [1].
"Round numbers can also act as support or resistance on a price chart... because of how the human mind tries to make sense of the world." - Binance Academy [1]
Savvy traders often anticipate these psychological levels by placing their orders slightly above support or slightly below resistance [9]. This approach helps ensure their orders are executed before the broader market reacts to the round number.
Moving Averages and Trend Lines
In addition to historical patterns, technical tools like moving averages and trendlines can refine your analysis.
Moving averages act as dynamic support and resistance levels. Popular choices, like the 50-day and 200-day moving averages, are closely monitored by traders [2]. These averages provide support during uptrends and limit prices during downtrends. For instance, Bitcoin’s 200-week moving average has historically offered strong support during bear markets [1]. Unlike static levels, moving averages shift with the latest price data, making them especially valuable in trending markets.
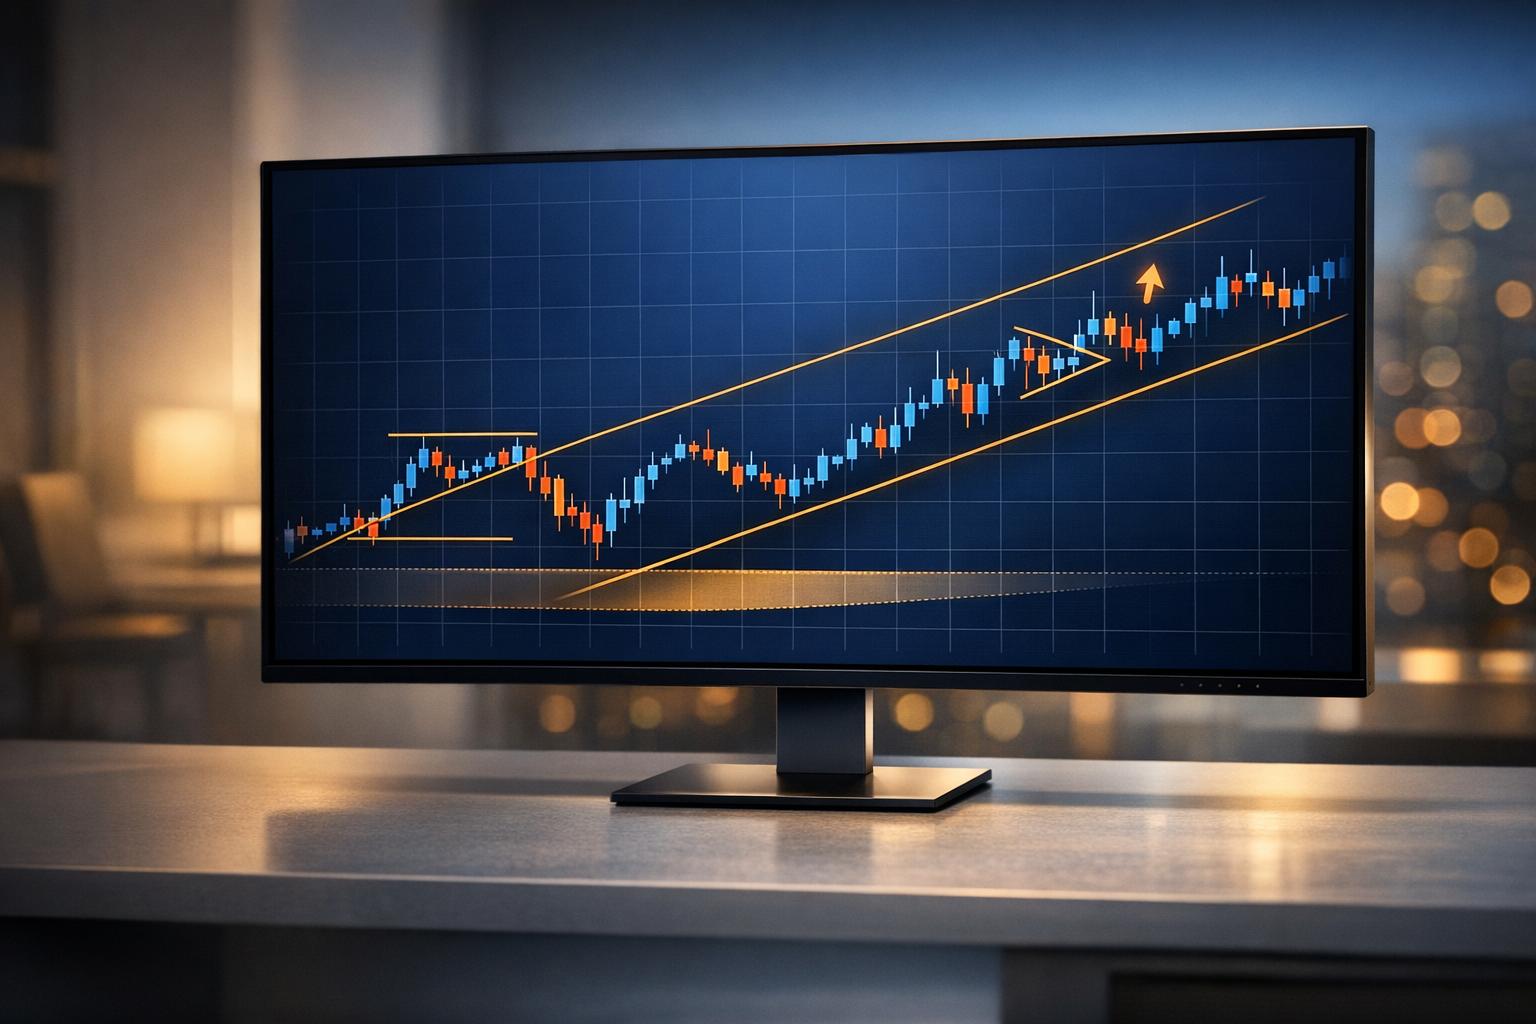
Trendlines are another useful tool. By connecting at least three higher lows in an uptrend, you can identify diagonal support. Conversely, linking three lower highs in a downtrend reveals diagonal resistance [3]. The most reliable levels often emerge where multiple indicators overlap or "converge" [9].
Trading Strategies Based on Support and Resistance

Once you've pinpointed key support and resistance zones, the next step is to use targeted strategies to navigate market movements effectively. These strategies help you make informed decisions by focusing on how prices behave around these critical levels.
Range Trading Strategy
Range trading thrives in markets moving sideways between two defined levels. The idea is simple: buy near support and sell near resistance, capitalizing on the price fluctuations within this range [5][11]. Timing is crucial - wait for the price to approach the edges of the range before entering a trade.
However, there's always the risk of an unexpected breakout. If the price breaks through either the support or resistance level, your position could quickly turn unfavorable. To protect yourself, set stop-loss orders just outside the range and use a crypto position sizing calculator to manage your risk. This precaution limits losses in case the market shifts from a sideways pattern to a trending one [5].
Bounce Strategy
The bounce strategy aims to profit from price reversals near support or resistance levels. For example, if you notice a long lower wick forming at a support zone, it’s often a sign that buyers are stepping in to defend the level [2]. This could be your cue to enter a long position, anticipating a price increase from that support.
Keep an eye out for additional confirmation signals, such as candlestick rejections or spikes in trading volume. These indicators can give you more confidence that the level will hold, reducing the risk of entering prematurely.
Breakout Strategy
Breakout trading focuses on entering positions when the price decisively moves through a support or resistance level. This often signals a shift in sentiment and technical analysis indicators, signaling the beginning of a new trend [4][7]. A great example is Bitcoin in 2021: the $60,000 mark served as strong resistance, with multiple rejections at that level. Traders who waited for a confirmed breakout above $60,000 positioned themselves for significant upward momentum [11].
To avoid falling for false breakouts, wait for a full candle close beyond the level, ideally accompanied by strong trading volume [7][10]. Another tactic is to look for a "retest", where the price revisits the broken level and bounces off it. This retest confirms that the old resistance has now turned into new support, offering a safer entry point with better risk-reward potential [1][10].
| Feature | True Breakout | False Breakout (Fakeout) |
|---|---|---|
| Candle Action | Full-body close beyond the level [10] | Wick rejection only; price stays in range [10] |
| Trading Volume | Significant spike/high volume [7][10] | Low or declining volume [10] |
| Price Sustainability | Sustains above/below the level [10] | Reverses back into previous range [10] |
| Market Conviction | High; indicates a new trend [4] | Low; traps inexperienced traders [7] |
Risk Management and Best Practices
Once you've chosen your trading strategy, the next step is to safeguard your investments with disciplined risk management. Even the most thorough support and resistance analysis won't hold up without proper protections in place. Trading cryptocurrencies without these measures can lead to swift and substantial losses. Here are some practices to help you protect your capital.
Setting Stop-Loss and Take-Profit Orders
Stop-loss orders act as your safety net. They should be placed just beyond your support (for long positions) or resistance (for short positions) zones. This allows for normal price fluctuations while guarding against significant losses. Similarly, take-profit orders should be set near the opposing level to lock in gains. It's important to remember that support and resistance are better thought of as zones rather than exact price levels.
"A stop-loss is like an insurance policy: You hope you never have to use it, but it's good to know you have the protection there." – Investopedia [12]
For trending markets, trailing stops can help you ride the momentum while still protecting your profits. Bracket orders, which let you set your entry, stop-loss, and take-profit levels all at once, can also simplify risk management. When trading volatile cryptocurrencies, you may need to adjust your stop-loss range. For relatively stable assets, a 5% to 8% range might suffice, while more volatile coins could require a buffer of 10% to 15% [12].
Combining Support and Resistance with Other Indicators
Support and resistance analysis becomes more effective when paired with additional technical indicators - a concept known as confluence. For instance, a support level that aligns with a major moving average, a critical Fibonacci retracement level (like 61.8%), or a psychological price point (such as $50,000) carries more weight.
Volume is another critical factor. A breakout or bounce accompanied by high trading volume often signals stronger market conviction, while low-volume moves can be misleading. Dynamic indicators, such as the 50-day or 200-day moving averages, and momentum tools like the Relative Strength Index (RSI), can further validate these zones.
"The setups that are confirmed by multiple strategies and indicators tend to provide the best opportunities." – Binance [1]
By combining these tools, you can increase the reliability of your analysis and trading decisions.
Updating Levels Regularly
Support and resistance levels are not fixed; they shift as market conditions change. A level that was reliable in the past might lose its significance or even reverse its role entirely. For example, a support level that breaks could turn into resistance. Additionally, while some traders believe that repeated tests of a level reinforce its strength, too many tests can actually weaken it, making it more likely to break.
"The only constant in the crypto market is that it is not constant." – KuCoin [3]
Make it a habit to reassess your levels after major price movements or significant news events. Keep in mind that levels identified on longer timeframes, such as weekly or monthly charts, generally carry more influence than those from shorter timeframes like 1-hour or 5-minute charts. Regular updates ensure your analysis stays aligned with the ever-changing market landscape.
Using StockioAI for Support and Resistance Analysis
Manual charting often feels like guesswork. As Binance Academy points out, "Identifying them [support and resistance] can be entirely subjective, they'll work differently in changing market conditions" [1]. This inconsistency makes it tough to rely on traditional methods. StockioAI steps in to solve this problem by automating the process, removing the guesswork, and making analysis more precise.
With StockioAI, identifying support and resistance levels becomes faster and more efficient. The platform processes data from over 11,000 cryptocurrencies [2], pinpointing critical levels that might otherwise take hours to chart manually. Instead of messy charts cluttered with arbitrary lines, StockioAI delivers clean, data-focused insights that highlight what truly matters.
Real-Time Support and Resistance Detection
StockioAI uses advanced algorithms to identify Liquidity Zones, areas of high trading activity often tied to institutional movements [10]. It also spots Broken Bases, which can signal buying opportunities when prices dip below previous support levels [10]. By analyzing highs and lows over set lookback periods, the system automatically maps out support and resistance zones [13].
The platform also factors in Round Number Magnetism and Fibonacci Cluster Zones - psychological price levels where traders frequently place orders. Chris Andreou, a seasoned trader at TIOmarkets, notes: "When charts are cluttered with irrelevant lines and indicators, it can potentially lead to misinterpretation of data or trigger analysis paralysis" [14]. StockioAI avoids this pitfall by focusing on key zones, delivering a streamlined analysis that naturally translates into actionable trading insights.
AI-Powered Trading Signals
StockioAI doesn’t stop at identifying zones - it integrates them into Buy, Sell, and Hold signals. These signals are powered by a combination of volume, moving averages, RSI, MACD, and market regime classification, achieving 80–90% accuracy. Whether you’re trading ranges, bounces, or breakouts, the platform’s recommendations align seamlessly with your strategies.
This automation allows traders to act quickly on breakouts or bounces without juggling multiple indicators. The system filters out low-volume moves to avoid false breakouts [10] and sends real-time alerts when prices approach critical zones. For Premium Access users ($29.99/month), the platform delivers automated updates every four hours for top cryptocurrencies like Bitcoin, Ethereum, Solana, and XRP.
Conclusion
Support and resistance levels play a key role in crypto trading, acting as the backbone of technical analysis. As Sophie Roots from Changelly aptly states:
"Support and resistance levels are not optional tools. They are the foundation of technical analysis. Without them, you're trading blind" [7].
These levels mark areas of buying and selling pressure, helping traders determine entry and exit points while managing risk effectively.
Manually identifying these levels can be a slow and subjective process. Viewing them as zones rather than precise lines accommodates market fluctuations, and waiting for confirmation - such as increased trading volume - can help avoid falling for false breakouts. Additionally, recognizing role reversals, where a broken resistance level transforms into new support, allows traders to stay agile in shifting market conditions.
Automation offers a solution to the challenges of manual analysis. AI-powered tools like StockioAI simplify the process by automatically detecting key levels and providing real-time Buy, Sell, and Hold signals with an impressive 80–90% accuracy. This reduces emotional decision-making and the subjectivity inherent in manual methods, reflecting the growing trend toward automated trading strategies.
Strong trading setups often arise when multiple indicators align. For example, a psychological round number paired with a Fibonacci retracement level and significant trading volume can create a high-confidence opportunity. By combining your knowledge of support and resistance with AI-driven tools, you can make quicker, more informed decisions. This blend of traditional analysis and advanced technology equips traders to navigate the unpredictable crypto market with greater efficiency.
FAQs
What’s the best way to identify support and resistance levels in crypto trading?
To pinpoint support and resistance levels effectively, start by analyzing higher time frames, such as daily or weekly charts. These broader views help you identify key zones where prices consistently bounce back (support) or hit a ceiling (resistance). Once you've marked these areas, shift to lower time frames to refine your entry and exit points. Pay attention to psychological price levels - those ending in round numbers like $10,000 or $25,000 - as they often act as natural barriers.
To strengthen your analysis, incorporate tools like trendlines, moving averages (e.g., 50-day or 200-day), and Fibonacci retracements. These tools can validate the levels you've identified. Watch for signs like volume surges, candlestick formations, or price consolidations near these zones, as they can serve as additional confirmation. For a more streamlined approach, platforms like StockioAI can automatically detect and map out support and resistance zones, helping you make faster and more confident trading decisions.
What are some effective strategies for trading around support and resistance levels in cryptocurrency?
Trading around support and resistance levels can be a smart approach when planned carefully. Here’s how you can make the most of these key price zones:
-
Place stop-loss orders wisely: For long trades, set your stop-loss just below a support level. For short trades, position it slightly above a resistance level. This way, you limit losses if the market moves unexpectedly.
-
Trade breakouts or wait for pullbacks: Consider going long when the price breaks above resistance or short when it dips below support. Another strategy is to wait for a pullback to the broken level - now acting as a new support or resistance - before entering your trade.
-
Leverage AI-powered tools: Platforms like StockioAI can enhance your trading by offering real-time signals, pattern detection, and risk management features. These tools can help pinpoint entry and exit opportunities with greater precision.
By blending solid risk management practices with advanced tools and methods, you can navigate price movements around support and resistance zones more effectively.
How does StockioAI help traders analyze support and resistance levels in crypto trading?
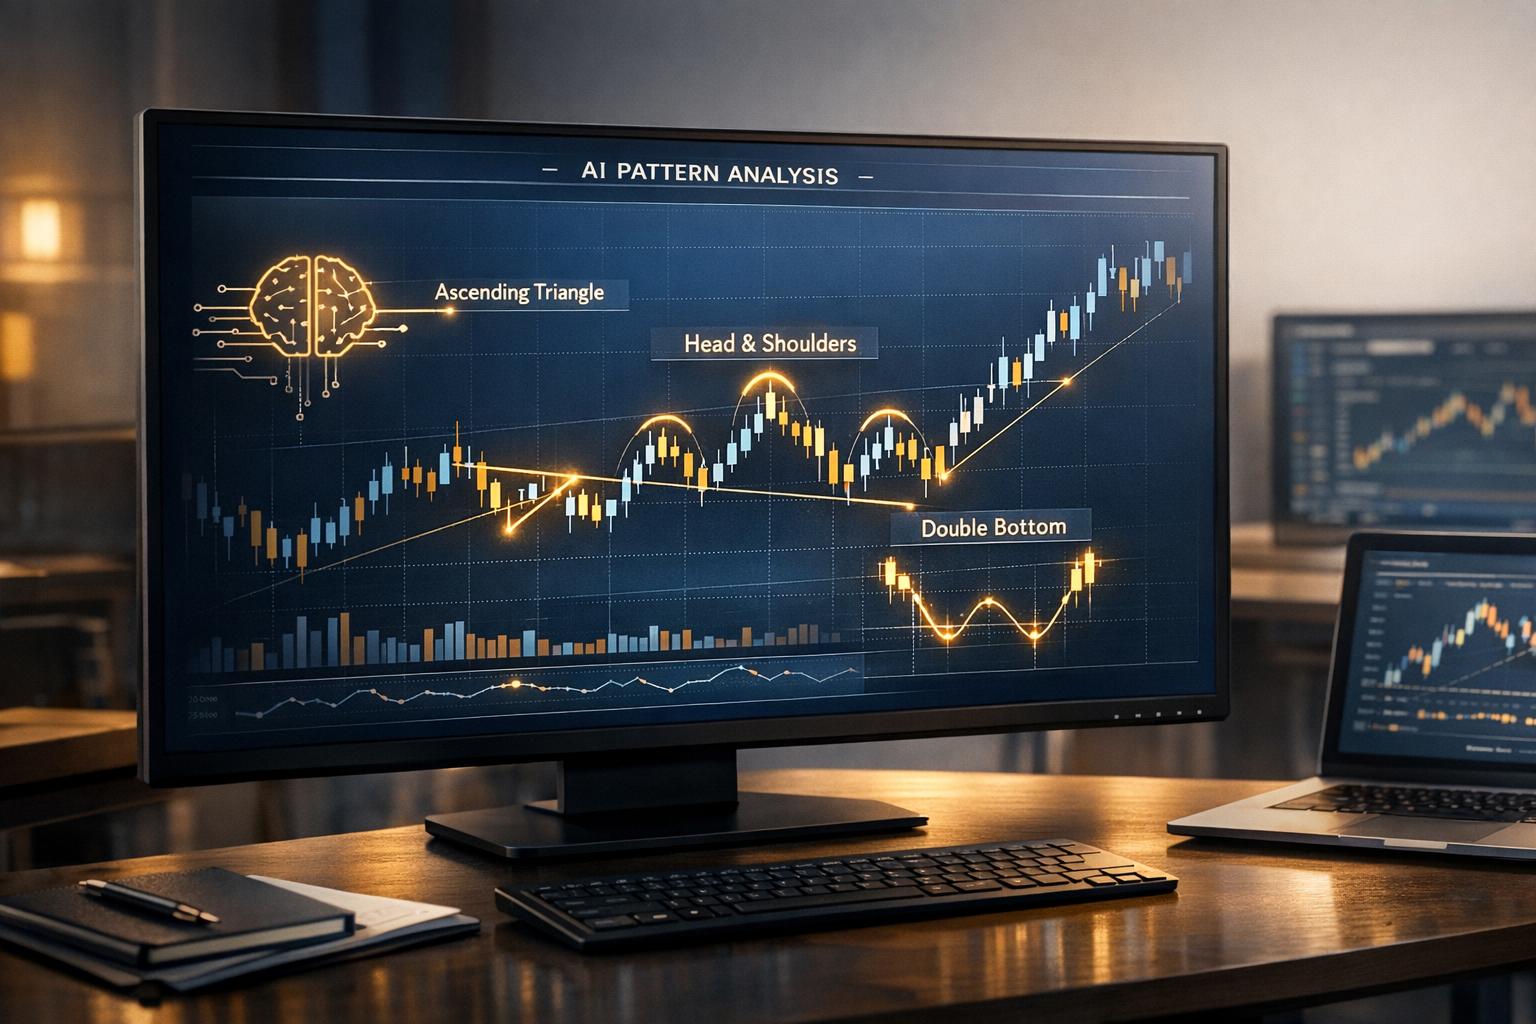
StockioAI takes the guesswork out of identifying support and resistance levels by using cutting-edge AI tools. With real-time chart analytics and pattern recognition, it helps traders pinpoint crucial price levels with accuracy, making it easier to make informed decisions.
On top of that, StockioAI offers precise Buy, Sell, and Hold signals paired with interactive chart analysis. These features simplify the process of understanding market trends, managing risks, and fine-tuning strategies as market conditions shift.