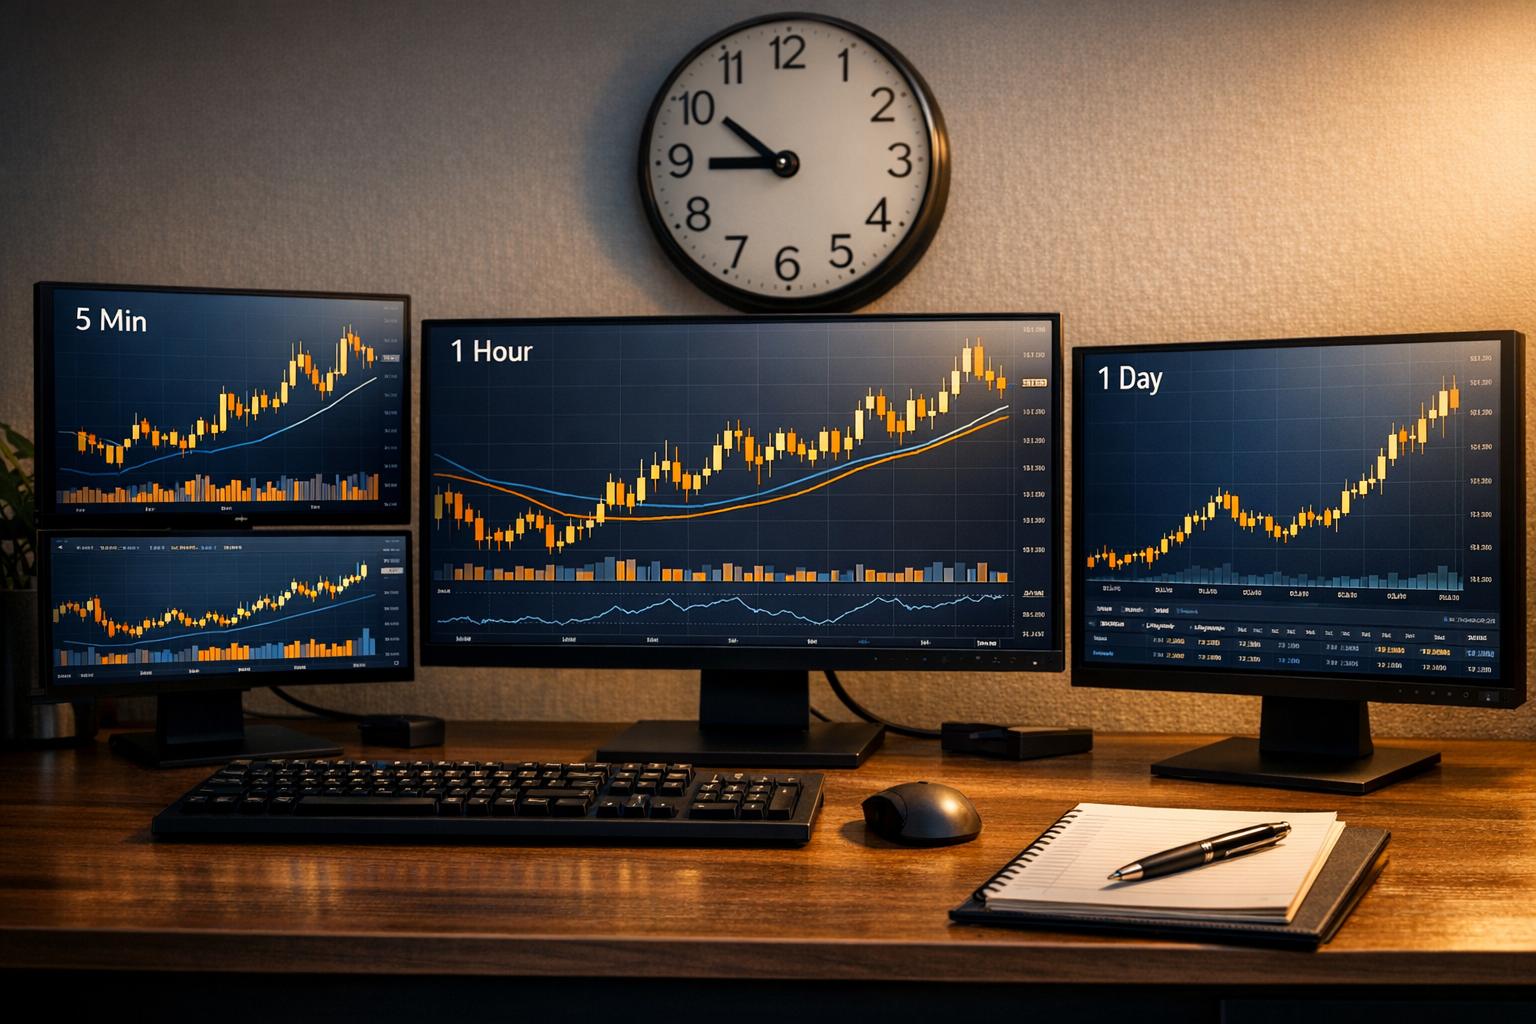
Choosing the right trading timeframe depends on your goals, schedule, and risk tolerance. Shorter timeframes (like 1-minute or 5-minute charts) suit quick trades but demand constant focus and are prone to noise. Longer timeframes (daily, weekly) offer clearer trends and require less frequent monitoring, ideal for those with less time to commit. Here's a quick breakdown:
- Scalping: Uses 1- to 5-minute charts for rapid trades. Best for full-time traders.
- Day Trading: Relies on 5-minute to 1-hour charts to close trades within a day.
- Swing Trading: Uses 4-hour to daily charts for holding positions over days or weeks.
- Position Trading: Focuses on weekly or monthly charts for long-term investments.
If you're new, starting with daily charts can help cut through market noise while allowing you to build skills. Consider your daily routine and emotional temperament before committing to a style. For example, scalping requires constant attention, while swing trading offers flexibility for those with full-time jobs.
Market liquidity also matters. Peak activity occurs during the London-New York overlap (12:00–4:00 PM UTC), making it ideal for short-term trades. Quieter periods, like weekends, may favor longer timeframes to avoid noise.
Test your strategy with demo trading before risking money. Tools like StockioAI can simplify analysis across multiple timeframes, helping you align short-term decisions with long-term trends. Start small, monitor performance, and adjust as needed to match changing market conditions.

The BEST Time Frame Trading Futures, Forex, Stocks & Crypto
Understanding Your Trading Strategy and Goals
Your trading strategy should align with your schedule, personality, and comfort with risk. Zain Vawda, Market Analyst at OANDA, puts it succinctly:
"The single most crucial decision a market participant makes is selecting a trading style that is suitable for a trader's needs and ambitions" [14].
Start with your daily schedule - it’s a practical limitation. If you’re tied up with a full-time job, it’s unlikely you can keep an eye on 1-minute charts all day. Then consider your emotional temperament. Some traders excel at making split-second decisions, while others need time to process and plan. Lastly, think about your risk tolerance. Shorter timeframes often mean more trades and higher stress, while longer timeframes demand patience to ride out daily price swings.
Common Trading Styles Explained
In the cryptocurrency world, four trading styles dominate, each with its own timeframes and level of commitment.
- Scalping focuses on capturing small price movements within seconds or minutes. Traders use 1- to 5-minute charts for quick entries and exits [6][12].
- Day trading involves closing all positions within the same day to avoid overnight risk. It relies heavily on sentiment and technical analysis, with traders typically using 5-minute to 1-hour charts to capture intraday volatility [6][9][10].
- Swing trading is a more relaxed method, holding positions for days or weeks to capitalize on medium-term price swings. Swing traders check markets less frequently, relying on 4-hour and daily charts [7][8][12].
- Position trading, also known as trend trading or investing, aims for long-term gains over months or years. This style uses weekly or monthly charts and focuses on broader fundamentals [8][6][12].
Here’s a quick overview of these styles:
| Trading Style | Typical Holding Period | Primary Chart Timeframes | Time Commitment |
|---|---|---|---|
| Scalping | Seconds to minutes | 1-min to 5-min | Very High |
| Day Trading | Minutes to hours | 5-min to 1-hour | High |
| Swing Trading | Days to weeks | 4-hour to Daily | Moderate |
| Position Trading | Months to years | Weekly to Monthly | Low |
As the CFI Analysts team explains:
"There is no single 'best' timeframe, it depends on: Your trading style, Your availability to monitor the market, [and] Your risk tolerance in trading" [6].
Once you understand these styles, the next step is to align them with your financial goals.
Setting Your Trading Goals
Now that you’re familiar with different trading styles, it’s time to figure out which one best suits your financial targets. Your goals should guide your choice. For example, if you’re looking for daily income and can dedicate hours to active trading, day trading or scalping might be ideal. On the other hand, if your aim is long-term wealth building and you’d rather check the markets weekly, position trading could be a better fit. If you want something in between - capturing trends without constant oversight - swing trading is often the go-to option [12][11].
Set clear and measurable targets that match your lifestyle. Ask yourself: How many hours can I realistically dedicate to trading each day? Do I enjoy fast-paced decisions, or do I prefer taking my time to analyze? Can I handle the stress of quick price swings, or do I need a slower pace? Your answers will naturally guide you toward a suitable trading style. Dan Buckley, Chief Analyst at DayTrading.com, notes:
"The optimal chart timeframe is highly dependent on your trading style" [12].
However, your trading style should also reflect the realities of your daily life.
For most beginners, starting with medium-term timeframes - like 1-hour to 4-hour charts or even daily charts - is a smart move. These timeframes help cut through market noise while still offering enough opportunities to build your skills. Justin Bennett advises:
"The daily time frame is the best place for most traders to start because it cuts through market noise and shows cleaner market trends" [5].
Once you’ve chosen a trading style, test it out with a crypto trading signal simulator to refine your approach [8][10].
Common Timeframes for Crypto Trading
Timeframe Categories Defined
Matching your chart intervals to your trading style is key to understanding trends clearly. Cryptocurrency charts are grouped by the length of their intervals, each serving different trading approaches. Minute-based timeframes (M1, M5, M15, M30) display price movements over 1 to 30 minutes. While they provide detailed updates, they can be quite noisy. These are commonly used by scalpers and day traders who rely on quick, precise data [3][6].
Hourly timeframes (H1, H4) give a broader look at intraday trends. Charts covering 1-hour or 4-hour intervals help traders spot overall trends without being distracted by smaller price swings. These timeframes are ideal for trades that last from a few hours to several days [3][12].
The daily (D1) timeframe filters out much of the market's volatility, making it easier to see the core trend [3][5].
For those focused on the bigger picture, weekly (W1) and monthly (MN1) timeframes highlight market cycles over extended periods. These are perfect for identifying major trend reversals that unfold over months or even years [3][12].
As the CFI Analysts put it:
"Choosing the right chart timeframe is like picking the right tool for the job. Short timeframes are faster paced... while the longer timeframes offer a more calm, big-picture view" [6].
The table below provides a quick overview of these timeframe categories.
Timeframe Comparison Table
| Timeframe Category | Common Intervals | Typical Trading Style | Holding Period | Volatility Exposure |
|---|---|---|---|---|
| Short-term | M1, M5, M15 | Scalping / Day Trading | Seconds to Hours | Very High |
| Medium-term | H1, H4, D1 | Swing Trading | Days to Weeks | Moderate |
| Long-term | W1, MN1 | Position Trading / Investing | Months to Years | Low |
Factors to Consider When Selecting a Timeframe
Matching Timeframes to Your Schedule
Your daily routine plays a big role in determining which trading timeframe suits you best. For example, scalping and day trading require constant attention - you’ll need hours of uninterrupted focus to react to rapid price changes [6][12]. If you have a full-time job or other responsibilities, trying to juggle these fast-paced strategies can lead to stress and burnout.
On the other hand, swing trading, which uses 4-hour to daily charts, is much more flexible. You only need to check the markets once or twice a day, making it a great fit for part-time traders [12][3]. This allows you to review your positions in the morning before work and again in the evening without worrying about missing major market moves.
Here’s a breakdown of how different trading approaches align with time commitments and trader profiles:
| Trading Style | Typical Timeframes | Time Commitment | Best For |
|---|---|---|---|
| Scalping | 1-minute to 5-minute | Constant | Full-time traders aiming for quick, small profits [6][12] |
| Day Trading | 15-minute to 1-hour | Intraday | Traders who can dedicate several hours daily [12][1] |
| Swing Trading | 4-hour to Daily | Moderate (Daily checks) | Part-time traders or those with full-time jobs [12][16] |
| Position Trading | Weekly to Monthly | Low (Weekly checks) | Long-term investors focusing on macro trends [12][3] |
As Coin Bureau explains:
"The shorter you go, the more you'll feel micro-volatility and execution costs; the higher you go, the more you rely on broader trend structure and patience" [15].
Aside from your schedule, understanding market liquidity and global trading sessions is key to optimizing your strategy.
Liquidity and Global Trading Sessions
While your availability determines which trading style you can manage, understanding liquidity patterns across global sessions helps refine your approach. Even though cryptocurrency markets operate 24/7, liquidity levels fluctuate significantly throughout the day. The most active and volatile period is during the London-New York overlap (approximately 12:00–4:00 PM UTC), when institutional traders from both regions are active [15][17]. This window offers tighter bid-ask spreads and better trade execution - critical for short-term strategies.
Research across 1,940 trading pairs shows that trading activity and volatility peak between 4:00–5:00 PM UTC, often referred to as "U.K. tea time" [15]. Meanwhile, the U.S. session (1:00–9:00 PM UTC) consistently delivers the highest volatility and more positive average hourly returns compared to other sessions [15].
Weekend trading, however, tells a different story. It typically sees lower volume and wider spreads, accounting for about 35% of weekly crypto trading volume [15]. Executing large trades during late-night UTC hours or on weekends can lead to slippage and unpredictable price swings [15]. If your schedule only allows trading during these less active periods, using longer timeframes like the daily chart can help filter out noise from low-liquidity sessions [17][5].
| Session | Time (UTC) | Liquidity Level | Characteristics |
|---|---|---|---|
| Asian | 11:00 PM – 8:00 AM | Moderate/Low | Choppier price action and reduced volumes for major pairs [17] |
| London | 7:00 AM – 4:00 PM | High | Heavy institutional flow; clearer directional moves [17] |
| New York | 12:00 PM – 9:00 PM | Very High | Highest volatility; major news releases [17] |
| London-NY Overlap | 12:00 PM – 4:00 PM | Peak | Best window for clean trends and breakouts [17] |
For strategies like scalping and high-frequency day trading, peak liquidity periods are ideal [15][17]. However, if you’re swing trading or using higher timeframes, session timing becomes less critical since you’re focusing on broader trends that unfold over days or weeks [3][2].
Adjusting Timeframes Based on Market Conditions
When to Switch Between Timeframes
Adapting your trading timeframe to match evolving market conditions is key to staying effective and minimizing unnecessary risks.
Market behavior isn’t static - it shifts between trending, ranging, volatile, and quiet phases. Each phase calls for a different approach. For instance, during high-volatility periods, shorter timeframes like 1-minute or 5-minute charts can help you catch quick price movements. However, they also expose you to more random noise, which can lead to frequent stopouts. If that happens, consider switching to longer timeframes such as 4-hour or daily charts. As Justin Bennett, founder of Daily Price Action, puts it:
"The daily time frame is the best place for most traders to start because it cuts through market noise and shows cleaner market trends." [5]
In trending markets, combining multiple timeframes can fine-tune your strategy. Start by identifying the broader trend on a daily or weekly chart, then zoom in to a 1-hour or 15-minute chart to pinpoint entry opportunities. Ross Cameron, founder of Warrior Trading, highlights the importance of this approach:
"Higher time frames will provide you with the big picture of what is going on, and can save you from getting steamrolled by a major trend while you are chasing small surges in lower time frames." [4]
If your short-term signals clash with the overall trend seen on a higher timeframe, it’s often smarter to trust the larger perspective.
In quieter or range-bound markets, longer timeframes like daily or weekly charts help you focus on key support and resistance levels and key patterns without being distracted by minor price fluctuations. Scalpers might still prefer shorter timeframes, but they should be prepared for more noise. Ben Clay notes:
"During periods of high volatility, shorter time frames may provide more trading opportunities, while during stable periods, longer time frames may be more suitable." [3]
For example, traders analyzing a major cryptocurrency’s long-term uptrend on a weekly chart confirmed the trend on a daily chart. They then used a 4-hour chart to identify precise entry points. This flexible approach allowed them to ride the rally while avoiding premature exits, demonstrating how adjusting timeframes can make a meaningful difference.
Testing and Refining Your Timeframe Selection
Validating Timeframes with Demo Trading
Before risking actual money, test your chosen timeframe in a demo environment for three to six months [20][21]. This trial period allows you to evaluate how well your strategy works under current market conditions while practicing discipline - without the financial risk.
Use two key approaches during this phase: backtesting (analyzing historical data) and paper trading (simulating trades in live markets) [20][21]. For strategies based on daily timeframes, aim to use at least 3–5 years of historical data. This ensures you account for various market phases, including bull, bear, and range-bound cycles [20]. Platforms like TradingView offer a "Bar Replay" feature, which lets you manually advance candles one at a time. You can log hypothetical entries and exits in a spreadsheet for detailed analysis. TradingView provides a 30-day free trial, with paid plans starting at $12.95 per month [20].
When testing multiple timeframes together, maintain a 1:4 or 1:6 ratio between shorter and intermediate timeframes to ensure consistency in your analysis. For instance, if you use a 4-hour chart to analyze trends, test a 1-hour chart for identifying entry points [13]. This approach helps reduce conflicting signals.
Track consistent metrics across all tested timeframes, such as the Sharpe Ratio (aim for a range of 1.0 to 2.0 for beginner-friendly strategies), Profit Factor (gross profit divided by gross loss), and Maximum Drawdown (crypto strategies typically range between 20% and 40%) [20]. For robust crypto strategies, a win rate between 45% and 65% is common [20]. As Wijdan Khaliq wisely puts it:
"A backtest is a filter, not a promise" [20].
Armed with these demo trading insights, you’ll be better prepared to monitor real-time performance and fine-tune your strategy.
Monitoring Performance and Making Adjustments
While demo trading helps confirm the mechanics of your strategy, live trading reveals how you handle emotional challenges. Pay close attention to your emotional responses and any impulsive decisions you make, as these can signal when market noise is clouding your judgment [20]. If shorter timeframes lead to frequent impulsive actions, consider switching to higher timeframes to reduce distractions.
Once your demo trading results are solid, transition to live trading cautiously, using only 1% to 5% of your capital [20]. Start conservatively to account for real-world factors like slippage and latency. Keep evaluating your performance using the same metrics from your testing phase. If your win rate drops significantly or drawdowns exceed your acceptable range, pause and reassess. This could indicate changing market conditions or that your timeframe no longer aligns with your strategy.
Finally, periodically review whether your chosen timeframe still matches your schedule and trading goals. Markets evolve, and what worked six months ago might need adjustments to remain effective.
How StockioAI Supports Timeframe Analysis
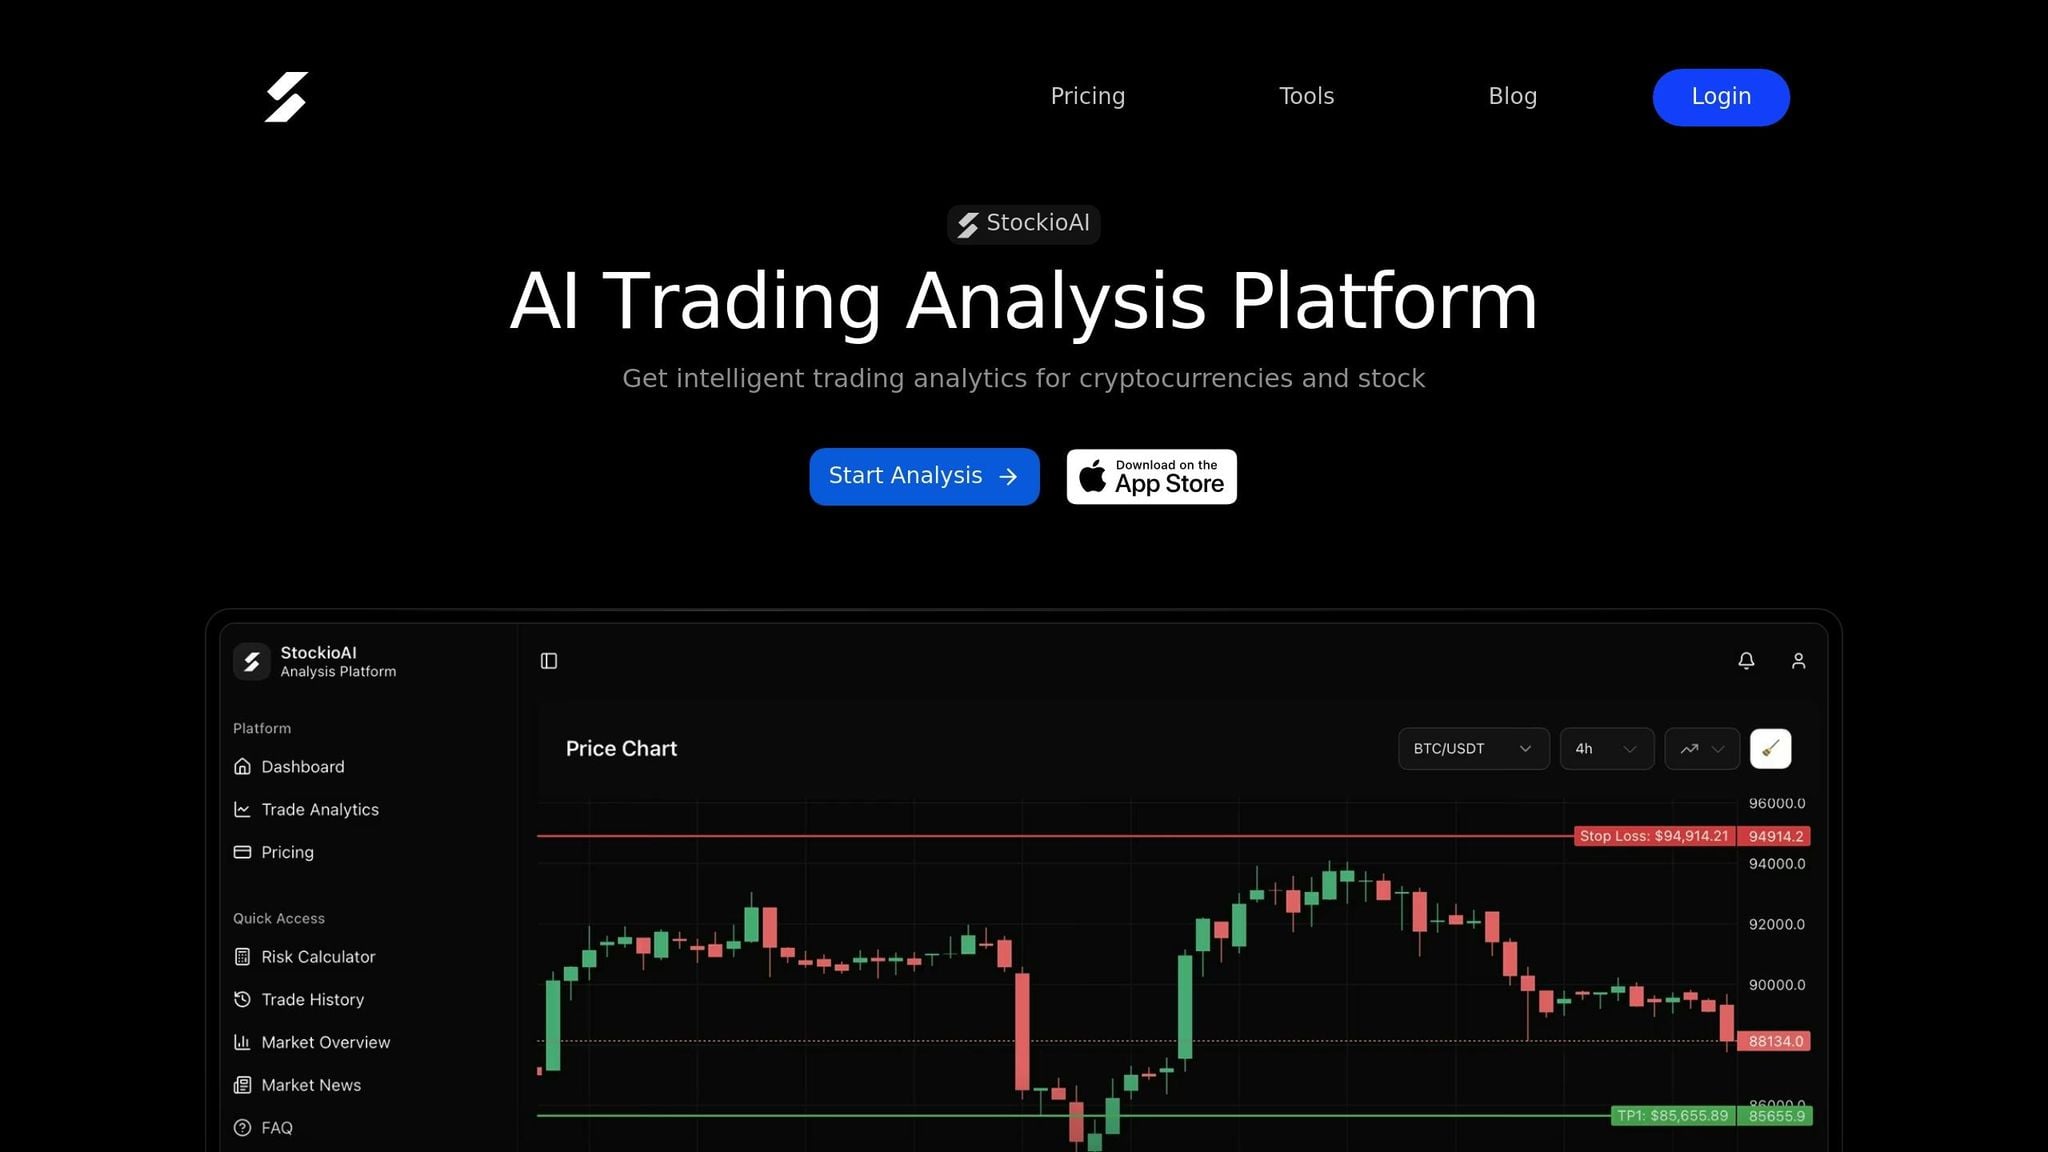
Once you’ve nailed down your preferred timeframe strategy, leveraging advanced tools can take your analysis to the next level. StockioAI’s multi-timeframe analysis (MTFA) tools let you examine crypto assets across 1-hour, 4-hour, and daily charts simultaneously, offering a more complete view of the market without the hassle of manually switching between charts [19][18]. This streamlined approach helps you spot alignment across different timeframes more efficiently.
The platform also uses AI-powered trading signals to identify the primary trend on higher timeframes, ensuring your short-term trades align with the broader market direction [18][13]. One standout feature is its ability to detect confluence - when multiple timeframes confirm the same trend - giving your trades a higher chance of success [22].
StockioAI simplifies trend analysis with visual cues like "Trend Triangles" and "Trend Diamonds", which highlight momentum across various intervals [22]. These indicators translate into actionable signals, such as "Strong Buy" or "Strong Sell", when conditions align, removing much of the guesswork. To keep you grounded in the bigger picture, the platform overlays higher timeframe trends directly onto your working chart, helping you balance long-term context with short-term precision.
Risk management is another key feature. StockioAI’s built-in tools let you adjust position sizes based on the volatility of your chosen timeframe, helping you trade more strategically. For those subscribed to Premium Access ($29.99/month), the platform offers automated crypto analysis every four hours for major assets like BTC, ETH, SOL, and XRP, so you can stay informed without constantly monitoring the charts.
When market conditions change, StockioAI’s Market Regime Classification system steps in to identify whether the market is trending, ranging, volatile, or quiet. Real-time alerts guide you to adjust your timeframe strategies accordingly [22][3]. By seamlessly integrating these dynamic tools into your trading approach, StockioAI ensures your strategy stays aligned with both real-time insights and your tested analysis.
Conclusion
Picking the right timeframe for trading isn’t about finding a universal answer - it’s about aligning your chart intervals with your trading style, schedule, and risk tolerance. As Justin Bennett, founder of Daily Price Action, explains:
"The daily time frame is the best place for most traders to start because it cuts through market noise and shows cleaner market trends" [5].
Charts with longer timeframes, like daily or weekly, help filter out unnecessary noise and provide a clearer picture of the market's overall direction.
To build a solid strategy, the top-down approach remains a reliable option. Start by analyzing the longest timeframe to identify the primary trend, then move to shorter intervals for more precise entry and exit points. Applying the 1:4 rule - where your shortest timeframe is about one-fourth of your intermediate one - keeps your analysis consistent and minimizes conflicting signals [13]. This structured approach also helps guard against confirmation bias.
As market conditions change, so should your timeframe strategy. Shorter timeframes may offer more opportunities during periods of high volatility, while calmer markets often favor longer intervals [3][12]. Regularly reviewing your performance will help you recognize when a particular timeframe no longer aligns with your goals - whether that’s because you’re missing trades or taking on too much risk. Adjusting to these shifts is essential for staying effective.
If you’re still refining your strategy, demo trading is a great way to experiment without risking real money [3]. For those balancing a full-time job, swing trading on 4-hour or daily charts is often more practical than attempting to scalp on 1-minute intervals. Find a pace that matches your availability and comfort level with market speed. These steps reinforce the importance of a disciplined and flexible trading approach.
FAQs
How can I choose a trading style that fits my daily routine?
To align your crypto trading style with your daily schedule, start by assessing how much time you can realistically dedicate to trading. If you only have brief windows of availability, styles like swing trading or position trading might be a better match since they require less frequent monitoring. On the other hand, if you can commit to longer, uninterrupted periods, day trading or scalping could be more suitable.
Think about how actively you want to trade. Scalping demands constant attention and quick decision-making, while swing trading or position trading offers more flexibility, requiring only periodic check-ins. The choice also ties into the chart timeframes you’ll use: shorter timeframes, such as 1- to 5-minute charts, are ideal for scalping, while longer ones, like daily or weekly charts, are better suited for swing and position trading.
Once you’ve identified a style that fits your time and preferences, test it out. Tools like StockioAI’s real-time analytics and risk calculators can help you simulate trades and assess whether your chosen approach aligns with your schedule and goals. This way, you can build consistency without feeling overwhelmed.
What are the risks of trading crypto on shorter timeframes?
Trading on shorter timeframes comes with its fair share of challenges. The increased market noise often makes it harder to distinguish genuine trends from false signals, which can lead to mistakes. On top of that, this style of trading demands constant monitoring, which can quickly result in stress and mental fatigue.
Another drawback is the higher transaction costs that come with frequent trades. These costs can add up fast, eating into potential profits. Plus, the heightened volatility typical of shorter timeframes can magnify losses if the market moves against you. To navigate these risks effectively, having a well-defined strategy and a solid risk management plan is absolutely essential.
What’s the best way to test a crypto trading strategy before using real money?
To experiment with your crypto trading strategy without putting real money on the line, here’s a simple approach you can take:
-
Set clear rules: Define precise conditions for entering and exiting trades, as well as how you'll manage risk. For example, you might decide, "Buy when the 15-minute EMA crosses above the 50-minute EMA and the RSI drops below 30." Writing these rules down ensures consistency.
-
Work with historical data: Collect high-quality price data for the cryptocurrency pairs you’re interested in. Tools like StockioAI make it easier by offering reliable datasets and analytics.
-
Backtest your strategy: Use historical data to simulate how your trading approach would have performed in the past. Platforms like StockioAI provide backtesting features that mimic real market conditions, helping you assess the strategy’s potential.
-
Try paper trading: Once you’ve fine-tuned your approach, test it in a live market simulation. This lets you see how it holds up in real-time scenarios - without risking actual money.
By combining backtesting with paper trading, you can fine-tune your strategy and approach live trading with greater confidence.