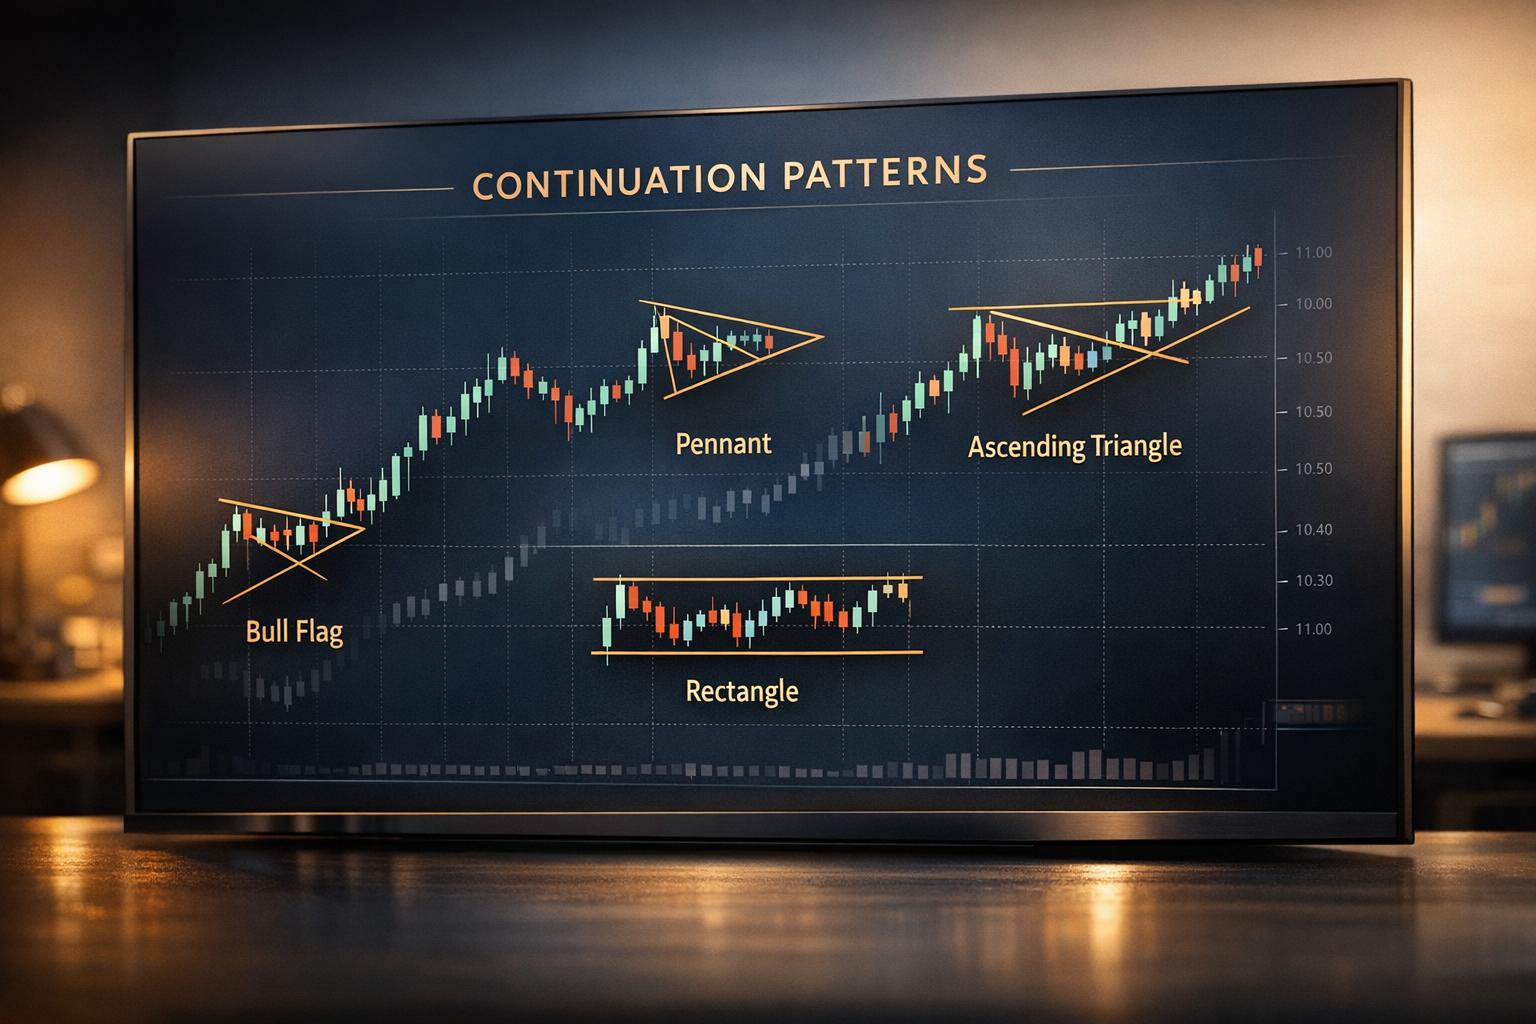
Continuation patterns are chart formations that signal a brief pause in an ongoing trend before it resumes its direction. They help traders identify when to stay in a trade or plan precise entries and exits. Popular patterns include flags, pennants, triangles, and rectangles. These patterns typically form during consolidation phases after a strong price move and resolve with a breakout in the trend's original direction.
Key takeaways:
- Types of Patterns: Flags (sloping channels), Pennants (triangles), Triangles (ascending, descending, symmetrical), and Rectangles.
- Confirmation: Look for a breakout accompanied by a volume surge (50%+ above average).
- Risk Management: Use stop-loss orders outside the pattern's boundaries and calculate profit targets based on the pattern's height.
- Indicators: Combine patterns with tools like RSI, MACD, and moving averages to improve accuracy.
How to Use Continuation Patterns in Your Crypto Trading Strategies
What Are Continuation Patterns?
Continuation patterns are chart formations that suggest a pause or consolidation within a trend before the price resumes its original direction. Think of it like a short pit stop during a race - the market takes a brief break but continues moving in the same direction afterward. Unlike reversal patterns, which signal a potential trend change, continuation patterns appear mid-trend following a strong price movement and typically resolve by continuing that trend.
These patterns are especially useful in crypto trading because they help confirm your current position. When you notice a flag, pennant, triangle, or rectangle forming on your chart, it’s a sign of temporary balance between buyers and sellers - not a reversal. The pattern is considered complete when the price breaks out of its boundaries, ideally with a trading volume surge of 50% or more.
Market Psychology Behind Continuation Patterns
Continuation patterns reflect a natural pause in market activity. After a strong price movement, early participants may take profits, while new traders hold back to see if the trend will last. This creates a short period of balance, where neither buyers nor sellers dominate, leading to sideways price action.
During this consolidation phase, trading volume usually drops, signaling indecision or a lack of strong conviction to reverse the trend. As Tom DeMark puts it:
"Volume is essential confirmation. Without confirming volume, price breakouts are suspect and prone to failure." [5]
Once the market regains momentum, a breakout with a 2–3x surge in volume often confirms the continuation of the trend. These psychological dynamics lay the groundwork for the technical characteristics of continuation patterns.
Common Characteristics of Continuation Patterns
Continuation patterns share several defining features. First, they only occur within a pre-existing trend - these patterns don’t emerge in flat or choppy markets. Second, they involve a consolidation phase where the price moves sideways or within a tighter range, forming a distinct geometric shape. Finally, they include a breakout point that aligns with the original trend, signaling when the price exits the pattern and resumes its direction.
Here’s a comparison of continuation patterns versus reversal patterns:
| Characteristic | Continuation Pattern | Reversal Pattern |
|---|---|---|
| Market Context | Forms mid-trend after a sharp move | Forms at the extreme of a trend |
| Primary Signal | Indicates a pause before the trend resumes | Signals a potential trend reversal |
| Resolution | Breaks out in the original trend direction | Breaks out in the opposite direction |
| Examples | Flags, Pennants, Rectangles, Triangles | Head and Shoulders, Double Top/Bottom |
Main Continuation Patterns for Crypto Traders

Continuation patterns are a crucial part of crypto trading. They represent moments where a trend takes a brief pause before resuming its previous direction. spotting these patterns early with AI chart analysis can help traders time their entries more effectively and avoid mistaking short consolidations for trend reversals.
Flag Patterns (Bullish and Bearish)
Flag patterns are made up of two parts: the flagpole and the flag. The flagpole represents a sharp, high-volume price movement - upward for bullish trends and downward for bearish ones. The flag itself forms a narrow channel between two parallel trendlines, sloping slightly against the initial move. In bullish flags, this channel often slopes downward or stays flat, while bearish flags slope upward or remain horizontal [8].
Volume typically spikes during the flagpole phase, drops during the consolidation, and surges again during the breakout - ideally by 50% or more [5]. For instance, after its December 2023 listing on Gate.io, SOLS/USDT formed a bull flag on the 30-minute chart. Following a sharp price surge, it consolidated around $2.00 for five candles on reduced volume before breaking out and climbing to $3.00 [11].
To validate a flag pattern, the consolidation should not retrace more than 50% of the flagpole's height [9]. Bullish flags often respect the 38.2% Fibonacci retracement level [8]. While flags in traditional markets may last 1–3 weeks, crypto's 24/7 trading environment accelerates this process, often resolving within 5 to 20 price bars [10]. Traders usually enter long positions (for bull flags) after the price closes above the upper trendline or short positions (for bear flags) after a close below the lower trendline [10]. Stop-loss orders are commonly placed just outside the opposite side of the flag's range. To set a profit target, measure the flagpole's height and project that distance from the breakout.
Now, let’s shift to a similar yet distinct pattern: the pennant.
Pennant Patterns (Bullish and Bearish)
Pennants resemble flags but differ in their consolidation phase, which forms a small, symmetrical triangle instead of a rectangular channel. Like flags, they start with a sharp flagpole, but the consolidation phase is marked by converging trendlines as buyers and sellers reach a temporary balance.
Volume peaks during the flagpole, decreases during the pennant, and spikes again at the breakout point. Because pennants are tighter and more compact, they tend to resolve even faster - sometimes within just a few hours on lower timeframes. To determine a profit target, measure the flagpole's height and project that distance from the breakout point [7].
For longer-term consolidations, triangle patterns offer a variety of setups.
Triangle Patterns (Ascending, Descending, and Symmetrical)
Triangles are longer-term patterns that can take weeks or even months to develop. They come in three types: ascending (rising support with horizontal resistance), descending (falling resistance with horizontal support), and symmetrical (converging highs and lows). Each type typically breaks out in the direction of the prevailing trend.
These patterns become most actionable as the price nears the apex - the point where the trendlines converge - indicating an imminent breakout. Wait for a candle to close outside the triangle before entering a trade, and look for a volume spike of 2–3 times the average to confirm the breakout [5]. To set a profit target, measure the triangle’s height at its widest point and project that distance from the breakout level. If the price reaches the apex without breaking out, the pattern's effectiveness can diminish, leading to sideways movement.
Rectangle Patterns
Rectangle patterns represent extended periods of consolidation where the price moves between horizontal support and resistance levels. Unlike flags or pennants, rectangles don’t slope; they reflect a balance between buyers and sellers, often while the market waits for a significant event or catalyst.
You can trade rectangles by buying near support and selling near resistance, or by waiting for a breakout in the direction of the prevailing trend. Once a breakout occurs, measure the rectangle’s height and project that distance from the breakout point to set your profit target. A noticeable volume increase can confirm the breakout.
Mat Hold Pattern (Bullish)
The mat hold pattern is a strong bullish continuation signal derived from candlestick analysis. It begins with a long bullish candle (the flagpole), followed by several small bearish candles that retrace part of the initial move. Ideally, these bearish candles should retrace between 25% and 38% of the flagpole’s height and not exceed a 50% retracement [12]. The pattern concludes with a final strong bullish candle that breaks above the high of the initial candle, signaling that buyers have regained control.
Though less common, the mat hold pattern is a reliable indicator of bullish momentum. The small bearish candles often reflect temporary profit-taking rather than a reversal. The final bullish candle, accompanied by strong volume, confirms that the uptrend is ready to resume. To calculate the profit target, measure the flagpole's height and project that distance from the breakout point.
How to Spot Continuation Patterns in Real-Time
Catching continuation patterns as they develop takes more than just watching the charts. A structured method that blends volume analysis, momentum indicators, and trend filters can help you separate promising setups from market noise. In crypto's non-stop, high-volatility environment, a valid pattern at 2:00 AM could quickly turn into a false signal. Let’s break down the tools and strategies that can help you identify real opportunities.
Key Indicators for Pattern Detection
Volume analysis is your first line of defense. During a pattern's formation, volume typically tapers off as the price consolidates. When a breakout happens, look for a volume spike - ideally 50% above the average, or even 2–3 times higher. Breakouts without this volume surge often fizzle out [5][7].
Momentum indicators offer additional confirmation. For bullish setups like flags or ascending triangles, the RSI should stay above 50 and show an upward trend. Similarly, the MACD crossing above its signal line indicates that the trend has strength [5]. Moving averages also act as trend filters - patterns forming above the 20 and 50 EMAs in an uptrend are generally more reliable than those in sideways markets [5].
When it comes to risk management, the ATR (Average True Range) can help you place stop-loss orders. Setting your stop-loss 1–2 ATR beyond the pattern boundary can provide a safety net [5][1]. For symmetrical triangles, pay attention to breakouts that occur between 50% and 75% of the triangle's length - breakouts near the apex often lack strength and fail [13].
| Pattern Stage | Volume Behavior | Action Signal |
|---|---|---|
| Formation | Declining volume | Indicates price consolidation |
| Breakout | 50%+ volume increase | Confirms breakout strength |
| Follow-through | Above average volume | Signals trend continuation |
Avoiding Fakeouts and False Signals
One golden rule: wait for the candle to close. This eliminates most false signals. A wick briefly piercing a trendline doesn’t count; you need a decisive close outside the pattern boundary [1].
Take Ethereum’s bullish pennant in early 2024 as an example. After rallying from $2,200 to $3,100, ETH consolidated between $2,800 and $3,000 with steadily declining volume. The pattern was confirmed only when ETH broke above $3,000 on a strong volume surge, eventually climbing to $3,500 within a week.
Aligning with the broader trend is just as important. A bullish flag in a larger downtrend is more likely to trap traders than present a real opportunity. Check that the price is above the 50 and 200 SMAs to ensure the continuation pattern aligns with the dominant trend. For added confidence, use the ADX (Average Directional Index) to confirm the strength of the trend [5][1].
Duration matters, too. Flags and pennants that form too quickly may lack enough market participation, while those stretching beyond 20 bars on your chosen timeframe can lose reliability as continuation signals [2][4]. Research shows traders using a combination of price patterns and technical indicators achieve a 62% win rate, compared to 48% for those relying only on patterns [5].
With this systematic approach, you can also leverage advanced tools like StockioAI for real-time monitoring and validation.
Using StockioAI for Real-Time Pattern Recognition
Navigating these complexities is easier with automated tools. StockioAI simplifies pattern detection by scanning for liquidity clusters and voids, assigning quality scores to each detected pattern [5]. This helps filter out low-probability setups that lack strong institutional interest.
StockioAI’s backtesting feature evaluates how specific patterns have performed under various market conditions. For example, it can analyze whether Bitcoin bull flags perform well in the current volatility environment [5]. One forex trader reported that using AI-driven tools improved their win rate from 52% to 68% by fine-tuning entry points and stop-loss levels [5].
The platform integrates key metrics - like real-time volatility, momentum indicators, and volume analysis - into a single dashboard. When it identifies a continuation pattern, it cross-references the setup with RSI, MACD, and moving averages to validate its strength [5]. This multi-layered approach reduces the subjectivity often involved in manual pattern recognition. What one trader sees as a bull flag, another might interpret differently - but StockioAI provides a consistent, data-driven perspective.
For crypto traders, StockioAI’s auto-analysis feature runs every four hours, scanning major assets like BTC, ETH, SOL, and XRP. Paired with real-time alerts, this ensures you won’t miss high-quality setups, even if you’re not glued to your screen. By combining automation with technical insights, StockioAI helps traders act on the best opportunities without the constant grind of manual monitoring.
Trading Strategies for Continuation Patterns
Entry and Exit Techniques
When trading continuation patterns, timing your entry and exit is everything. A general rule is to wait for a candle to close outside the pattern - above resistance for bullish setups or below support for bearish ones. This approach helps reduce the risk of jumping in too early [1][6].
Volume is another critical piece of the puzzle. A breakout confirmed by a volume surge can strengthen your trade decision. Once you’ve confirmed the breakout with both price action and volume, consider placing your stop-loss just outside the consolidation range [2][7]. Alternatively, you can set it 1–2 Average True Range (ATR) away from the pattern to account for normal market fluctuations [1][5].
In the fast-moving world of crypto trading, limit orders can help you avoid slippage [6]. To steer clear of fakeouts - especially common in 24/7 markets - waiting for a retest of the broken support or resistance level can be a smart move. For taking profits, consider scaling out of your position. Start by taking partial profits at your measured move target, then use a trailing stop to lock in gains while staying open to extended trends [5].
With these entry and exit rules in place, fine-tune your strategy to align with the market’s trend direction. Using a crypto market trend analyzer can help you identify these shifts in real-time.
Adjusting Strategies for Bullish and Bearish Patterns
Refining your approach based on the trend direction can make a big difference. For bullish patterns like flags or ascending triangles, indicators such as the Relative Strength Index (RSI) and Exponential Moving Averages (EMAs) can provide extra clarity. Ideally, the RSI should be above 50 and climbing, with the price trading above both the 20 and 50 EMAs [5]. On the flip side, bearish setups like descending triangles or bear pennants often show an RSI below 50 and declining, with the price staying below these EMAs [5].
The MACD indicator is another useful tool. A bullish MACD crossover - when the MACD line moves above the signal line - can confirm upward momentum for long trades. Conversely, a bearish crossover signals downward pressure, favoring short positions [5]. Research shows that combining these indicators with price patterns can improve win rates from 48% to 62% [5].
Your stop-loss placement should also reflect the pattern type. For bullish flags, placing the stop 1–2 ATR below the flag’s lower boundary offers a safety net. In bearish rectangles, positioning the stop just inside the rectangle’s upper resistance can protect against false upside breakouts [3][5]. Symmetrical triangles, which can break in either direction, may call for placing orders on both sides of the structure to capture the move [6].
Calculating Profit Targets
Setting a clear profit target is essential, and continuation patterns provide a straightforward way to do this. Measure the height of the pattern and project that distance from the breakout point [1][5][7]. For instance, in early 2023, Tesla formed a bullish pennant after surging from $115 to $215 - a $100 flagpole. After consolidating between $160 and $200, the stock broke out above $200 with strong volume. Traders projected a target of $300 by adding the flagpole height to the breakout point, and the stock eventually peaked at $291 [2].
For triangles and rectangles, use the widest part of the pattern to calculate your target. For wedges, measure from the highest point to the support line in bearish ascending wedges, or from the lowest point to the resistance line in bullish descending wedges, then project that distance [2][3][4].
To manage risk, aim for a minimum reward-to-risk ratio of 2:1 [2]. For extended targets, Fibonacci extensions - especially the 161.8% level - can be used as secondary profit zones [5]. Historical support and resistance levels also make logical exit points, as these areas often act as psychological barriers in crypto trading [2][3].
Risk Management for Continuation Pattern Trading
Confirming Patterns with Technical Analysis
Before diving into trades based on continuation patterns, it's crucial to validate them using technical indicators. Relying solely on reading crypto charts without confirmation can lead to unreliable outcomes.
Start by examining volume. A significant volume spike - at least 50% higher or 2–3 times above the average - is a strong signal of pattern validity [5][7]. As Tom DeMark explains:
"Volume is essential confirmation. Without confirming volume, price breakouts are suspect and prone to failure" [5].
Next, incorporate momentum indicators. For bullish patterns, ensure the RSI (Relative Strength Index) is above 50 and that the MACD (Moving Average Convergence Divergence) shows an upward crossover. For bearish patterns, look for an RSI below 50 and a downward MACD crossover. Data shows that traders who combine patterns with technical indicators achieve a 62% win rate, compared to 48% for those relying solely on patterns [5].
Finally, use moving averages as a trend filter. For bullish trades, the price should be above the 50-period and 200-period moving averages. Linda Raschke emphasizes the importance of this approach:
"Moving averages act as a trend filter, helping traders avoid false breakouts and stay on the right side of the market" [5].
Position Sizing and Stop-Loss Placement
Once you've confirmed a pattern, managing risk becomes essential. Start by keeping your risk per trade between 1–2% of your total trading capital [14]. For example, if your account balance is $10,000, your maximum loss per trade should range from $100 to $200. To calculate position size, use this formula: (Account Equity × Risk %) / (Stop Distance × Value per Point).
When setting stop-loss levels, consider structure-based stops. For bullish setups, place the stop just below the lower trendline of the flag or pennant. For bearish setups, position it above the pattern's resistance level [14].
Alternatively, use the Average True Range (ATR) to adjust stops for market volatility. Set your stop 1.5× to 2× the ATR away from your entry point. Day traders typically stick to a 1.5–2× multiplier, while swing traders might use 2–3× ATR for broader market movements [5][15].
Avoid placing stops at obvious round numbers like $2,000 or $50,000. These levels are often targeted by large market participants in a tactic known as "stop hunting." Instead, position your stop 1.5–2.5% beyond visible support or resistance levels [15]. To lock in profits, consider using a trailing stop once the trade moves 1.5× your initial risk in your favor [14].
Monitoring External Market Factors
Even when technical confirmation aligns perfectly, external market forces can disrupt the best-laid plans. Events such as SEC enforcement actions, exchange hacks, or central bank announcements can cause sudden spikes in volatility, often triggering stop-loss orders before reversing direction [15].
Liquidity is another critical consideration. Low-volume assets, particularly altcoins, are more susceptible to manipulation. Large holders, or "whales", can exploit thin order books to push prices through pattern boundaries, only to reverse course once retail traders enter [15]. Before trading any continuation pattern, check the asset's average daily volume and avoid low-liquidity scenarios [5].
During periods of heightened volatility, adjust your ATR multiplier by an additional 0.5–1.0× to allow for wider stops [15]. Given that the crypto market operates 24/7, always use hard stop-loss orders to protect against overnight crashes or sudden flash events [15].
Lastly, be mindful of time-based deterioration. If a breakout occurs but the price stalls and moves sideways for too long without hitting your target or stop, it may indicate fading momentum. In such cases, some traders choose to exit the trade based on time rather than price movement [15].
Conclusion
Continuation patterns offer crypto traders a structured way to navigate market consolidations and spot potential entry points with higher chances of success. These patterns reflect the market's natural flow - a brief pause for profit-taking and confirmation before the trend picks up again [7][6].
The key to success lies in confirmation, not prediction. Enter trades only after seeing a candle close outside the pattern, accompanied by a 50% increase in volume and confirmation from momentum indicators like RSI or MACD [5]. Data shows that traders who combine patterns with technical indicators achieve a 62% win rate, compared to just 48% for those relying solely on patterns - a solid 12% improvement [5]. This underscores the importance of using patterns as part of a broader strategy rather than relying on them in isolation [5].
Risk management is equally critical. Place stop-losses just outside the pattern's boundary or 1.5–2× ATR away, cap risk at 1–2% of your total equity, and use the measured move method to set realistic profit targets [5].
For traders looking to streamline their process, StockioAI provides tools like real-time pattern recognition, automated quality checks, and integrated technical analysis. Its AI-driven features eliminate the need for manual chart scanning, helping traders focus on execution. With Premium Access, users gain unlimited AI signals and auto-analysis updates every 4 hours for major cryptocurrencies like BTC, ETH, SOL, and XRP.
FAQs
How can I confirm a continuation pattern breakout in crypto trading?
To confirm a continuation pattern breakout in crypto trading, start by ensuring the price closes above the breakout level on your preferred timeframe, such as the 1-hour or 4-hour chart. A candle that closes above the resistance line (or below the support line for bearish patterns) provides a more dependable signal than a brief intraday spike.
Look for above-average trading volume accompanying the breakout. This indicates strong market participation and adds validity to the move. To further strengthen your analysis, consider using technical indicators like the RSI to confirm upward momentum or a bullish MACD crossover. Checking the breakout on a higher timeframe can also help filter out market noise and reduce the risk of false signals.
For added efficiency, tools like StockioAI can automate pattern recognition and send real-time alerts. These tools are designed to help traders identify breakouts and volume spikes quickly, saving time while enhancing accuracy.
What’s the difference between flags and pennants in crypto trading?
Flags and pennants are classic continuation patterns, signaling a temporary pause before the current trend picks up again. Though they serve a similar purpose, their shapes and durations set them apart.
-
Flags have a rectangular shape with parallel trendlines, resembling a flag attached to a pole. These patterns usually appear after a strong price movement and involve a longer consolidation period. This extra time can help traders refine their entry, target, and stop-loss strategies.
-
Pennants, on the other hand, are compact symmetrical triangles formed by converging trendlines. They emerge following a sharp price move but resolve much faster than flags, often leading to a quicker breakout in the direction of the existing trend.
Both patterns are valuable tools for pinpointing entry and exit opportunities. However, flags tend to indicate a more extended pause, while pennants highlight a brief, tighter consolidation before the trend resumes.
How can I use volume analysis to confirm continuation patterns in crypto trading?
Volume analysis plays a crucial role in confirming the reliability of continuation patterns like flags, pennants, or triangles. During the consolidation phase of these patterns, trading volume usually drops, indicating a lull in market activity. A genuine continuation pattern is often validated when the price breaks out of its formation with a sharp increase in volume. This surge reflects renewed market interest and momentum aligned with the prevailing trend.
To apply this approach effectively, look for a breakout that’s accompanied by a volume increase - typically 1.5 to 2 times the average volume observed during the consolidation phase. Volume-based indicators, such as On-Balance Volume (OBV), can further enhance your analysis. If OBV trends upward during the breakout, it’s a strong sign that the move is supported by real buying or selling pressure.
Platforms like StockioAI make this process easier by leveraging AI-driven tools to identify continuation patterns and analyze volume in real time. These tools provide actionable insights, helping you make more informed trading decisions.