EMA crossovers are a straightforward way to identify potential buy and sell signals in cryptocurrency trading. By tracking the interaction between short-term and long-term exponential moving averages (EMAs), traders can spot trends and shifts in momentum. Here’s what you need to know:
-
What is an EMA Crossover?
- A bullish crossover occurs when a short-term EMA moves above a long-term EMA, signaling a possible upward trend.
- A bearish crossover happens when a short-term EMA falls below a long-term EMA, indicating potential downward momentum.
-
Why Use EMA Crossovers?
- They work well in fast-moving markets like crypto, offering clear entry and exit signals.
- Common pairings include the 9/21 EMA for short-term trades and the 50/200 EMA for identifying long-term trends.
-
Limitations:
- EMA crossovers can lag during rapid price changes and may generate false signals in sideways markets.
- To improve accuracy, combine them with tools like RSI, volume analysis, or support and resistance levels.
-
How to Set Up:
- Add EMAs to your chart using platforms like TradingView. Use distinct colors for short-term and long-term EMAs to spot crossovers easily.
- For automation and deeper insights, platforms like StockioAI offer AI-driven tools to simplify EMA trading and reduce noise.
To trade effectively, pair EMA crossovers with solid risk management. Always use stop-loss orders, aim for favorable risk-reward ratios, and confirm signals with additional indicators. While EMA crossovers are not foolproof, they are a reliable tool when used in trending markets.
Learn The 9-20 EMA Crossover Intraday Trading Strategy In 11 Minutes (Live Examples!)
Setting Up EMA Indicators for Crypto Trading
To use EMA (Exponential Moving Average) indicators effectively, you'll need to choose the right periods, add them to your charts, and adjust them for better visibility.
Choosing EMA Periods for Different Strategies
The best EMA periods depend on your trading style and goals. Here's a breakdown of common setups:
- Short-term traders and scalpers: The 9/21 EMA combination works well on 5-minute to 1-hour charts. This setup reacts quickly to price changes, making it ideal for fast-paced trades.
- Swing traders: The 12/26 EMA pairing or 20/50 EMA setup is better suited for 4-hour or daily charts. These periods help smooth out market noise while still detecting meaningful trends.
- Long-term position traders: The 50/200 EMA crossover on daily or weekly charts is a reliable choice. Known as the "Golden Cross" (bullish) and "Death Cross" (bearish), this setup helps identify major market trends without getting distracted by short-term fluctuations.
| EMA Periods | Trading Style | Chart Timeframe | Signal Frequency | Best For |
|---|---|---|---|---|
| 9/21 | Scalping/Day Trading | 5min-1hr | High | Quick momentum trades |
| 12/26 | Swing Trading | 1hr-4hr | Moderate | Managing crypto volatility |
| 20/50 | Medium-term Trading | 4hr-Daily | Moderate | Following trends |
| 50/200 | Position Trading | Daily-Weekly | Low | Identifying major trends |
It's a good idea to test these settings on historical data to see what works best for your strategy. Be cautious of using periods that are too short, as they can generate false signals.
Adding EMA Indicators to Trading Platforms
Once you've chosen your EMA periods, the next step is to add them to your chart. If you're using TradingView, a popular platform among U.S. crypto traders, follow these steps:
- Open your BTC/USD chart.
- Click on the "Indicators" button and search for "EMA."
- Add your first EMA and set its period to your chosen fast EMA (e.g., 9 or 12).
- Repeat the process for your slow EMA, setting it to the longer period (e.g., 21 or 26).
- Customize the appearance - use different colors and line thicknesses to distinguish between the fast and slow EMAs (e.g., blue for fast and red for slow, with a 2–3 pixel line).
Make sure both EMAs are on the same chart so you can easily spot crossovers. While the menu layout may vary slightly on other platforms, the process is generally similar.
How StockioAI Simplifies EMA Setup
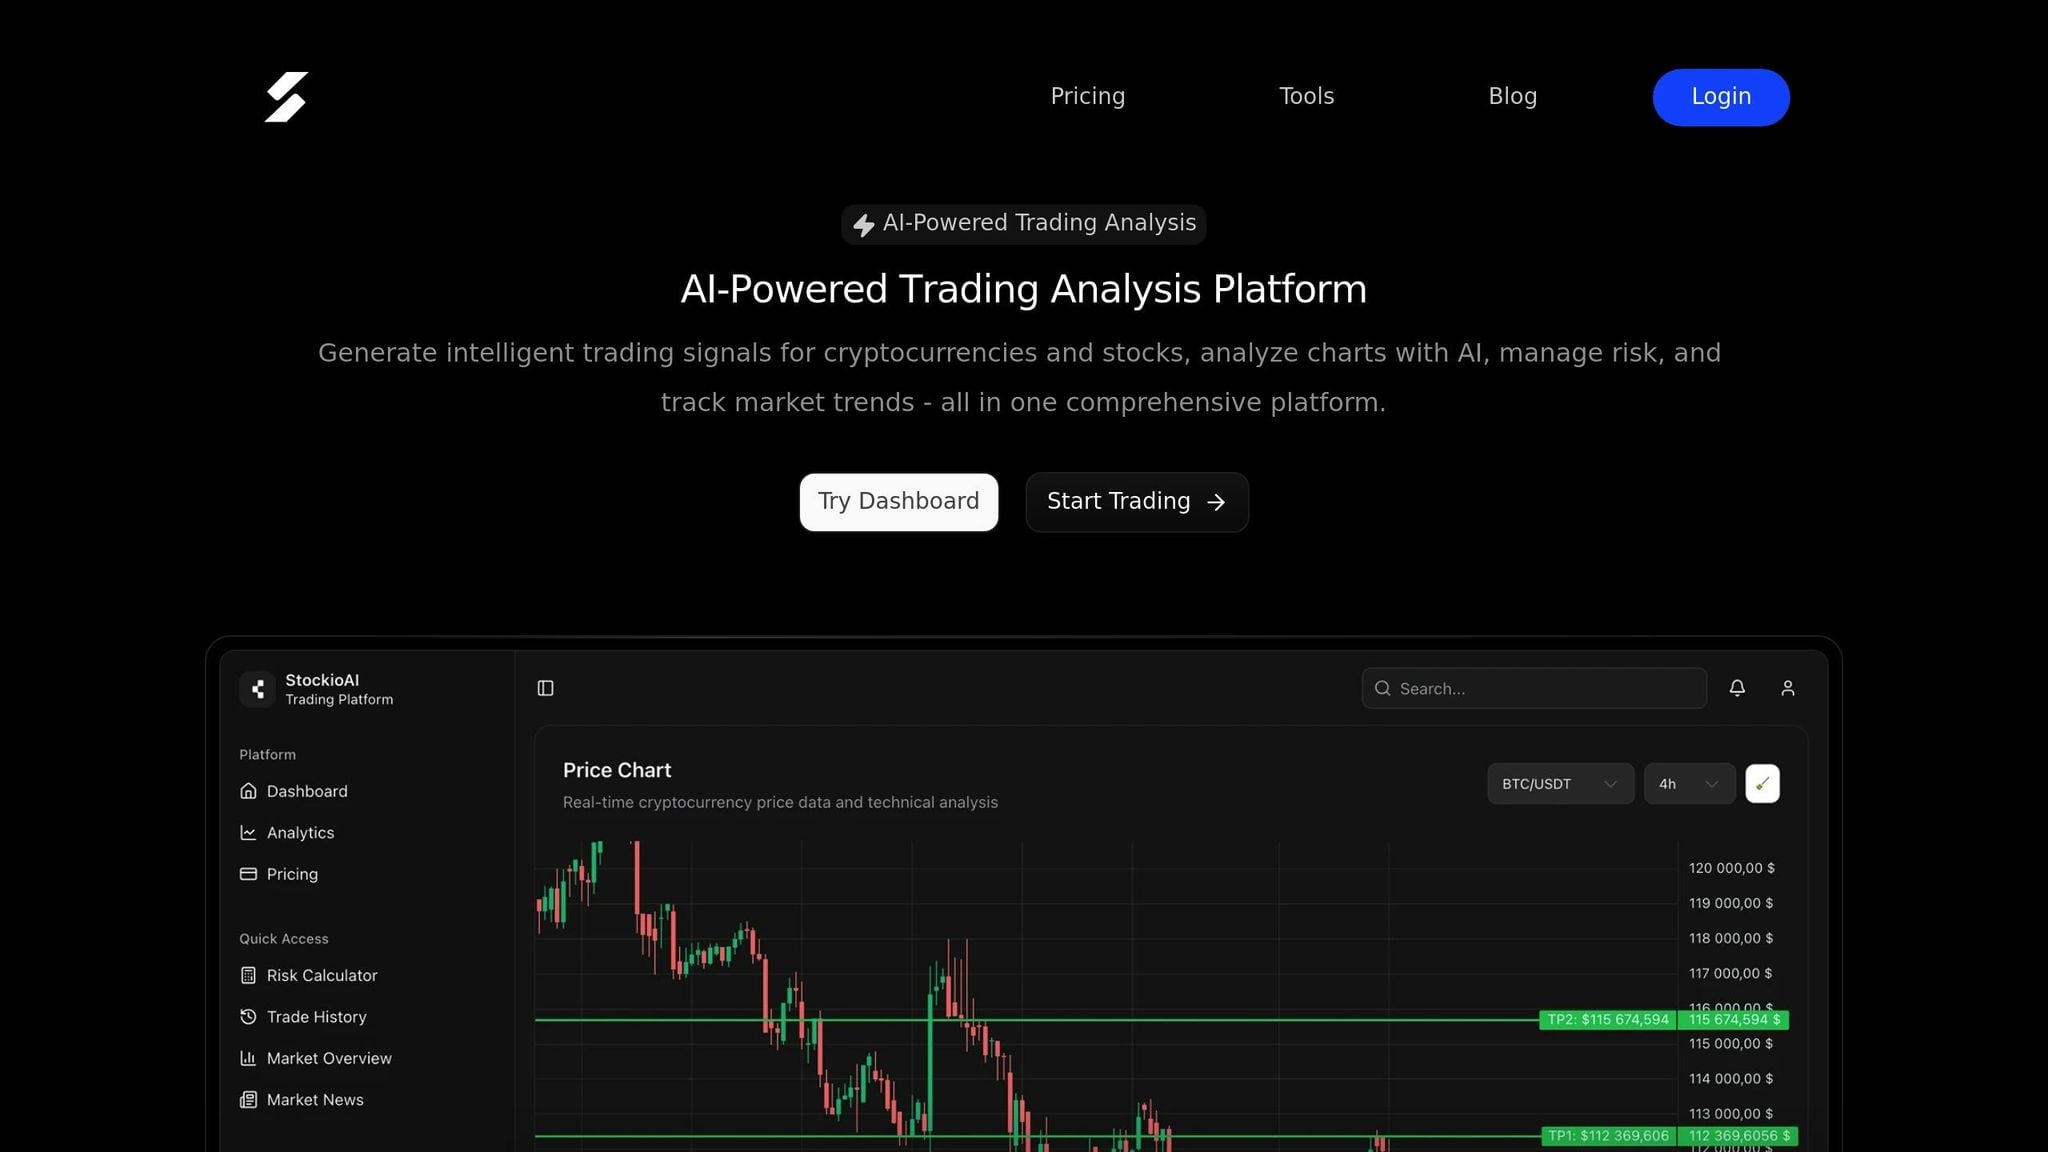
If manual setup feels tedious, StockioAI offers a streamlined alternative by automating EMA configuration and signal detection. Managing multiple charts and timeframes can be overwhelming, but StockioAI simplifies the process with its AI-powered tools.
The platform analyzes over 60 real-time data points, including EMA crossovers, to generate clear BUY, SELL, and HOLD signals. This eliminates the need to monitor charts manually, reducing the chances of missing key trading opportunities.
StockioAI also integrates seamlessly with Advanced TradingView charts, displaying AI-generated support and resistance zones, technical indicators, and other insights directly on your charts. For traders looking to customize their strategies, the platform's indicator library provides advanced options for fine-tuning EMA configurations.
This level of automation is particularly helpful in the volatile crypto market, where emotions can cloud judgment. StockioAI's 7-tier priority system goes beyond basic EMA signals, incorporating factors like market structure, volume, and momentum to deliver more reliable recommendations. This way, you can trade with greater confidence and precision, even during unpredictable market conditions.
Reading Buy and Sell Signals from EMA Crossovers
Once you’ve added EMAs to your chart, the next step is understanding how to interpret their signals. These signals can guide your decisions on when to enter or exit trades. The key to success lies in grasping the context behind these signals and how they align with market conditions.
Bullish and Bearish EMA Crossovers
EMA crossovers generate two primary signals: bullish and bearish. A bullish crossover happens when a short-term EMA moves above a long-term EMA, indicating potential upward momentum - a sign that it might be a good time to buy[2][1]. This suggests recent price action is gaining strength, and the asset could continue climbing.
On the flip side, a bearish crossover, often called a "Death Cross", occurs when the short-term EMA dips below the long-term EMA. This indicates possible downward momentum and could signal a selling opportunity[1]. It warns that the recent upward trend might be losing steam, potentially leading to a decline.
Traders often focus on crossovers involving the 50-day, 100-day, and 200-day moving averages[4]. For instance, when a 20-day EMA crosses above a 50-day EMA, it’s widely seen as a buy signal[3]. These signals become especially relevant in strongly trending markets. A sudden death cross after weeks or months of an uptrend could indicate the trend is nearing its end, with a reversal possibly on the horizon[4].
Ethereum’s price history shows it frequently bounces off its 100-day EMA during bullish runs, highlighting how moving averages can act as dynamic support and resistance levels in live markets[3].
Using Other Indicators to Confirm Signals
Relying solely on EMA crossovers can sometimes be misleading, especially in range-bound markets where price fluctuations cause frequent, false signals. To filter out these "whipsaws", traders often use additional indicators[4].
Volume and RSI are two popular tools for confirming EMA crossover signals[5]. When a crossover coincides with rising volume, it suggests stronger momentum behind the price movement, increasing the likelihood of a successful trade[5]. Volume essentially acts as the fuel for price action - without it, even the most promising crossover may fall flat.
The RSI (Relative Strength Index) helps assess whether an asset is overbought or oversold when the crossover occurs[5]. For example, a bullish crossover paired with increasing volume and an RSI reading below 70 (indicating it’s not overbought) strengthens the case for a buy signal. Similarly, a bearish crossover with rising volume and an RSI above 30 (not oversold) provides better confirmation for a sell signal.
Platforms like StockioAI take this a step further by analyzing over 60 real-time data points every second for signal confirmation. As they explain:
"Our intelligent trading system generates precise BUY positions based on 60+ real-time data points analyzed every second. Technical indicators, volume patterns, support levels, market sentiment, order book depth, whale movements, and social media trends are processed instantly."[6]
This level of analysis helps cut through market noise and reduces the impact of false signals, especially in volatile cryptocurrency markets.
Reading Market Context and Trends
The effectiveness of EMA crossover signals depends heavily on the broader market context. A bullish crossover carries more weight during a strong uptrend, as it aligns with existing momentum and confirms its continuation[1]. Similarly, a bearish crossover in a downtrend suggests the trend is deepening[1].
Higher timeframes, such as 4-hour or daily charts, tend to produce more reliable signals by filtering out short-term market noise[4]. Swing traders often prefer these higher timeframes, while scalpers working on shorter timeframes need additional confirmation tools to avoid false signals.
It’s also crucial to assess whether the market is trending, consolidating, or reversing. For example, if the market has been in a prolonged uptrend and a death cross suddenly appears, it may signal the end of that trend and the beginning of a reversal[4].
Support and resistance levels further enhance the reliability of crossover signals. When an EMA crossover happens near these levels, it often strengthens the signal. For instance, when a cryptocurrency’s price is above a moving average, that average often acts as support. Conversely, when the price is below it, the moving average can serve as resistance[1]. Traders frequently look for price reactions at these levels to fine-tune their entry and exit points[1].
StockioAI’s advanced algorithms simplify this process by automatically analyzing contextual market data:
"Advanced AI algorithms process 60+ real-time market indicators to detect optimal exit points and generate SELL positions. Our system continuously analyzes resistance levels, momentum indicators, market trends, volatility patterns, and institutional flows to recommend when to close positions."[6]
With these tools and insights, you’re better equipped to act on EMA crossover signals effectively. Up next, learn how to execute trades based on these confirmed signals.
Executing EMA Crossover Trades Step by Step
Now that you know how to interpret EMA crossover signals, it’s time to put that understanding into practice. Successfully executing trades based on these signals demands a well-thought-out plan, disciplined risk management, and a systematic approach to protect your capital while aiming for profit.
Complete EMA Crossover Trade Example
Let’s break down a Bitcoin trade using the widely-used 9 EMA and 21 EMA crossover strategy. This example walks you through every step, from spotting the signal to closing the trade.
Signal Identification: On a 1-hour BTC/USD chart, you spot the 9 EMA crossing above the 21 EMA at $40,000. This bullish crossover indicates potential upward momentum.
Confirmation: Before entering the trade, you look for additional signs. The crossover aligns with rising volume, and the RSI sits at 55 - comfortably below overbought levels. These factors reduce the chances of falling for a false breakout.
Trade Entry: You decide to go long at $40,000, right at the crossover point. While some traders prefer waiting for a pullback, this approach risks missing the move entirely.
Stop-Loss Placement: A stop-loss is placed at $39,500, just below the recent swing low, giving you a $500 margin of safety.
Take-Profit Target: The initial target is set at $41,000, a previous resistance level. This creates a 1:2 risk-reward ratio - risking $500 to potentially gain $1,000.
Trade Management: As Bitcoin approaches your profit target, you keep an eye on the EMAs. If the 9 EMA crosses back below the 21 EMA before hitting your target, you exit the trade to lock in gains.
Trade Outcome: Bitcoin surged before reversing, validating the decision to exit when it did.
This example highlights the importance of having a clear entry and exit strategy, paired with disciplined risk management. It’s a practical demonstration of how EMA crossovers can work within a structured trading framework.
Risk Management Rules for EMA Trading
Managing risk effectively is non-negotiable when trading with EMA crossovers. It’s your safety net during unpredictable market conditions.
-
Position Sizing: This is the cornerstone of risk management. Limit your risk to 1–2% of your total account balance per trade. Calculate the position size by dividing your risk amount (e.g., 2% of your account) by the distance to your stop-loss.
-
Stop-Loss Orders: Always use stop-loss orders. For long positions, place them just below recent support levels; for short positions, just above resistance.
-
Risk-Reward Ratios: Aim for a minimum 1:2 ratio, meaning your potential profit should be at least double your risk.
-
Avoid Overleveraging: While leverage can amplify gains, it also magnifies losses. Use it cautiously, especially in volatile markets.
-
Trade Confirmation: In sideways or choppy markets, don’t rely solely on crossovers. Look for additional signals, like volume spikes or RSI trends, to confirm the trade.
How StockioAI Improves Risk Management
Managing all these variables manually can be overwhelming, especially when juggling multiple trades across different timeframes. That’s where StockioAI steps in, automating key processes to help you stay disciplined.
The platform’s Risk Calculator simplifies position sizing, instantly calculating the optimal trade size, stop-loss levels, and leverage based on your account size and risk tolerance[6]. This minimizes errors, especially in fast-moving markets.
AI-Generated Trading Signals come with predefined risk parameters, removing emotions from the equation. According to StockioAI:
"StockioAI's intelligent trading system generates precise BUY positions that include clear entry points, stop-loss levels, and profit targets with confidence scores."[6]
The Position Tracking tool provides real-time updates on your active trades, showing profit and loss alongside detailed performance metrics[6]. This transparency helps you stick to your strategy instead of reacting impulsively to short-term price swings.
For exits, StockioAI’s algorithms continuously analyze market conditions to identify the best selling points:
"Advanced AI algorithms detect optimal exit points and generate SELL positions, recommending when to close positions based on resistance levels, momentum indicators, market trends, volatility patterns, and institutional flows."[6]
By processing over 60 real-time metrics every second[6], the system offers data-driven exit recommendations, keeping emotions out of your decisions.
Jordan Martinez, a quantitative trader, shared his experience with StockioAI:
"StockioAI revolutionized my trading strategy. The AI insights helped me achieve consistent 18% monthly returns."[6]
With these tools, StockioAI makes it easier to manage risk while executing EMA crossover strategies. This systematic approach ensures you’re prepared to navigate both the strengths and challenges of this trading method.
Pros and Cons of EMA Crossover Strategies
EMA crossover strategies come with both benefits and drawbacks. Understanding these can help you decide if this approach aligns with your trading goals.
Benefits of EMA Crossovers
EMA crossovers have several appealing features that make them a favorite among crypto traders, whether you're just starting out or have years of experience.
Straightforward, Rules-Based Signals: With EMA crossovers, you get clear, actionable signals. For example, when the 9 EMA crosses above the 21 EMA, it indicates a bullish trend. If the reverse happens, it signals bearish momentum. This clarity removes guesswork and helps you stick to your trading plan without letting emotions take over[2].
Quick Reaction to Price Changes: Unlike simple moving averages, EMAs prioritize recent price data, making them more responsive to current market conditions[2][7]. This is especially useful in the fast-moving crypto markets, where catching early trend changes can make a big difference.
Flexible for Different Timeframes: Whether you're into short-term scalping or longer-term swing trading, EMA crossovers work across a variety of timeframes[2][3]. This adaptability means you can tailor the strategy to fit your trading style and schedule.
Automation-Friendly: The binary nature of EMA crossover signals makes them ideal for automated trading. You can program bots with specific entry and exit rules, eliminating the need for constant monitoring or subjective decisions[3].
Spotting Trends and Reversals: EMA crossovers are excellent for identifying trend reversals. Patterns like the Golden Cross (short-term EMA crossing above long-term EMA) and Death Cross (short-term EMA crossing below long-term EMA) are widely recognized and can signal major market movements[1][5].
Drawbacks of EMA Crossovers
While EMA crossovers are widely used, they aren't without flaws. These limitations can sometimes hinder their effectiveness.
Lagging Behind Price Moves: Since EMAs are based on historical data, crossover signals often come after a significant price move has already occurred[2]. This delay can mean missing the most profitable entry points.
Struggles in Sideways Markets: In low-volatility or choppy conditions, EMA crossovers can generate multiple false signals, also known as whipsaws[3]. These false signals can lead to small, frequent losses that add up over time.
Sensitive to Market Noise: In highly volatile crypto markets, short-term price spikes can trigger crossovers that don't reflect actual trend changes. This can result in poorly timed trades.
Lack of Broader Context: EMA crossovers focus solely on price direction and don't consider other factors like support and resistance levels or overall market conditions. Relying only on crossovers can lead to trades that conflict with the bigger picture.
| Pros | Cons |
|---|---|
| Clear, objective buy/sell signals | Relies on historical data, causing lag |
| More responsive to price changes than simple moving averages | Prone to false signals in choppy markets |
| Works across different timeframes | Can be affected by short-term market noise |
| Easy to automate and backtest | Doesn't account for broader market context |
| Effective in trending markets | May miss the best entry/exit points |
How StockioAI Addresses Common Problems
StockioAI tackles the common issues of EMA crossover strategies by leveraging advanced AI tools and analytics that go beyond basic technical indicators.
Filtering Out False Signals: StockioAI processes over 60 real-time data points every second, including technical indicators, market sentiment, volume trends, and even social media activity[6]. This comprehensive analysis helps filter out the noise that often leads to false signals.
Early Detection of Market Shifts: Using machine learning algorithms, the platform can recognize patterns and predict trend reversals before they appear on traditional EMA crossovers[6]. This reduces the lag and allows traders to act sooner.
Avoiding Whipsaws: During periods of market consolidation, StockioAI provides HOLD recommendations based on its analysis of sideways trends and market structure[6]. This helps traders avoid the frequent false signals that are common in choppy markets.
Multi-Timeframe Analysis: StockioAI offers insights across multiple timeframes, allowing traders to confirm EMA crossover signals with broader market trends[6]. This added layer of context improves the reliability of trading decisions.
Detailed Risk Management: Every signal from StockioAI includes clear entry points, stop-loss levels, and profit targets, along with confidence scores[6]. This eliminates much of the uncertainty around position sizing and risk management.
Jordan Martinez, a quantitative trader, shared his experience with the platform:
"StockioAI revolutionized my trading strategy. The AI insights helped me achieve consistent 18% monthly returns."[6]
The results speak for themselves: StockioAI boasts a 75% win rate over 35 closed trades and a profit factor of 2.95[6]. By addressing the weaknesses of traditional EMA strategies, the platform transforms a basic indicator into a powerful tool for smarter, more informed trading decisions.
Start Trading EMA Crossovers with Confidence
Trading EMA crossovers effectively takes more than just recognizing the signals. To truly succeed, you need to pair these indicators with strong risk management practices and advanced tools that help cut through market noise.
To build confidence in trading EMA crossovers, start with a solid foundation. Focus on higher timeframes, such as 4-hour or daily charts, where signals tend to be more reliable and less affected by short-term market fluctuations[4]. As mentioned earlier, combining the 50/200 EMA crossover with broader market trends can provide one of the most dependable signals available to traders[4].
Risk management is key. Always set stop-loss levels just below recent support areas and aim to take profits at significant resistance levels[5]. Limit your risk to 1-2% of your portfolio per trade. This ensures that even a streak of losses won't severely impact your account balance.
Confirm your signals to avoid falling for false positives. Use additional indicators like volume spikes or RSI readings above 50 to validate bullish EMA crossovers[5]. Alternatively, a three-EMA strategy using 10, 20, and 50 EMAs can help filter out weaker signals[2]. Adding this layer of confirmation allows you to refine your strategy further, especially when using modern trading tools.
Advanced trading platforms can take your EMA crossover strategies to the next level. StockioAI is a game-changer, addressing the limitations of traditional methods by analyzing technical indicators, market sentiment, and whale activity[6]. This multi-faceted approach helps pinpoint high-probability setups while reducing the risk of false signals.
The platform’s AI-powered pattern recognition works hand-in-hand with your EMA analysis, offering deeper insight into trend reversals and ideal entry points. Each signal includes detailed reasoning, entry and exit points, stop-loss suggestions, and profit targets, all backed by confidence scores. This eliminates much of the uncertainty that can lead to poor trading decisions[6].
Start small and scale up gradually. Even seasoned traders can benefit from beginning with StockioAI's free plan, which includes 3 AI trading signals and educational resources. This allows you to experiment with integrating AI insights into your traditional EMA crossover strategies without any upfront risk[6].
For sustained success, commit to continuous learning and adapting your approach. Use position tracking tools to evaluate your performance, identify patterns in your trades, and make adjustments as needed. Keep in mind that not every EMA crossover is a valid signal, and patience is essential for long-term profitability[4].
Take the next step in your trading journey by exploring the advanced tools and strategies offered by StockioAI.
FAQs
How do I choose the best EMA periods for my crypto trading strategy?
When selecting the best EMA (Exponential Moving Average) periods, it all comes down to your trading objectives and the timeframes you’re working with. Shorter EMAs, such as 9 or 12 periods, react quickly to price changes, making them ideal for short-term trading or spotting quick buy and sell signals. On the other hand, longer EMAs, like 50 or 200 periods, help identify broader trends and filter out market noise.
To find the EMA periods that align with your strategy, experiment with different combinations on historical price data. A common approach is pairing a short-term EMA (e.g., 12) with a longer-term EMA (e.g., 26). This combination can highlight crossover points, which often signal potential entry or exit opportunities. Tools provided by platforms like StockioAI can make this process easier by analyzing EMA crossovers and delivering real-time trading signals tailored to your specific strategy.
What other indicators can I use with EMA crossovers to improve the accuracy of my crypto trading signals?
To improve the accuracy of your trading signals when working with EMA crossovers, consider pairing them with other technical indicators. Here are a few commonly used tools:
- Relative Strength Index (RSI): This helps spot overbought or oversold conditions, offering confirmation for potential trend reversals.
- MACD (Moving Average Convergence Divergence): Offers additional details on momentum and the strength of a trend.
- Volume Analysis: A higher trading volume can support the validity of a crossover signal.
By combining multiple indicators, you can reduce the chances of false signals and make better-informed trading decisions. Remember to test and adjust your strategy to align with your specific trading goals and risk tolerance.
How can StockioAI enhance the effectiveness of EMA crossover strategies in volatile crypto markets?
StockioAI empowers traders to refine their EMA crossover strategies with its cutting-edge tools, offering real-time trading signals and detailed technical analysis. By leveraging AI, it pinpoints potential buy and sell opportunities with impressive precision, even during rapidly shifting market trends.
Beyond signals, StockioAI provides a suite of features tailored for crypto traders, including risk calculators, interactive charting tools, and AI-based pattern recognition. These tools help traders navigate volatile markets with greater clarity and confidence.