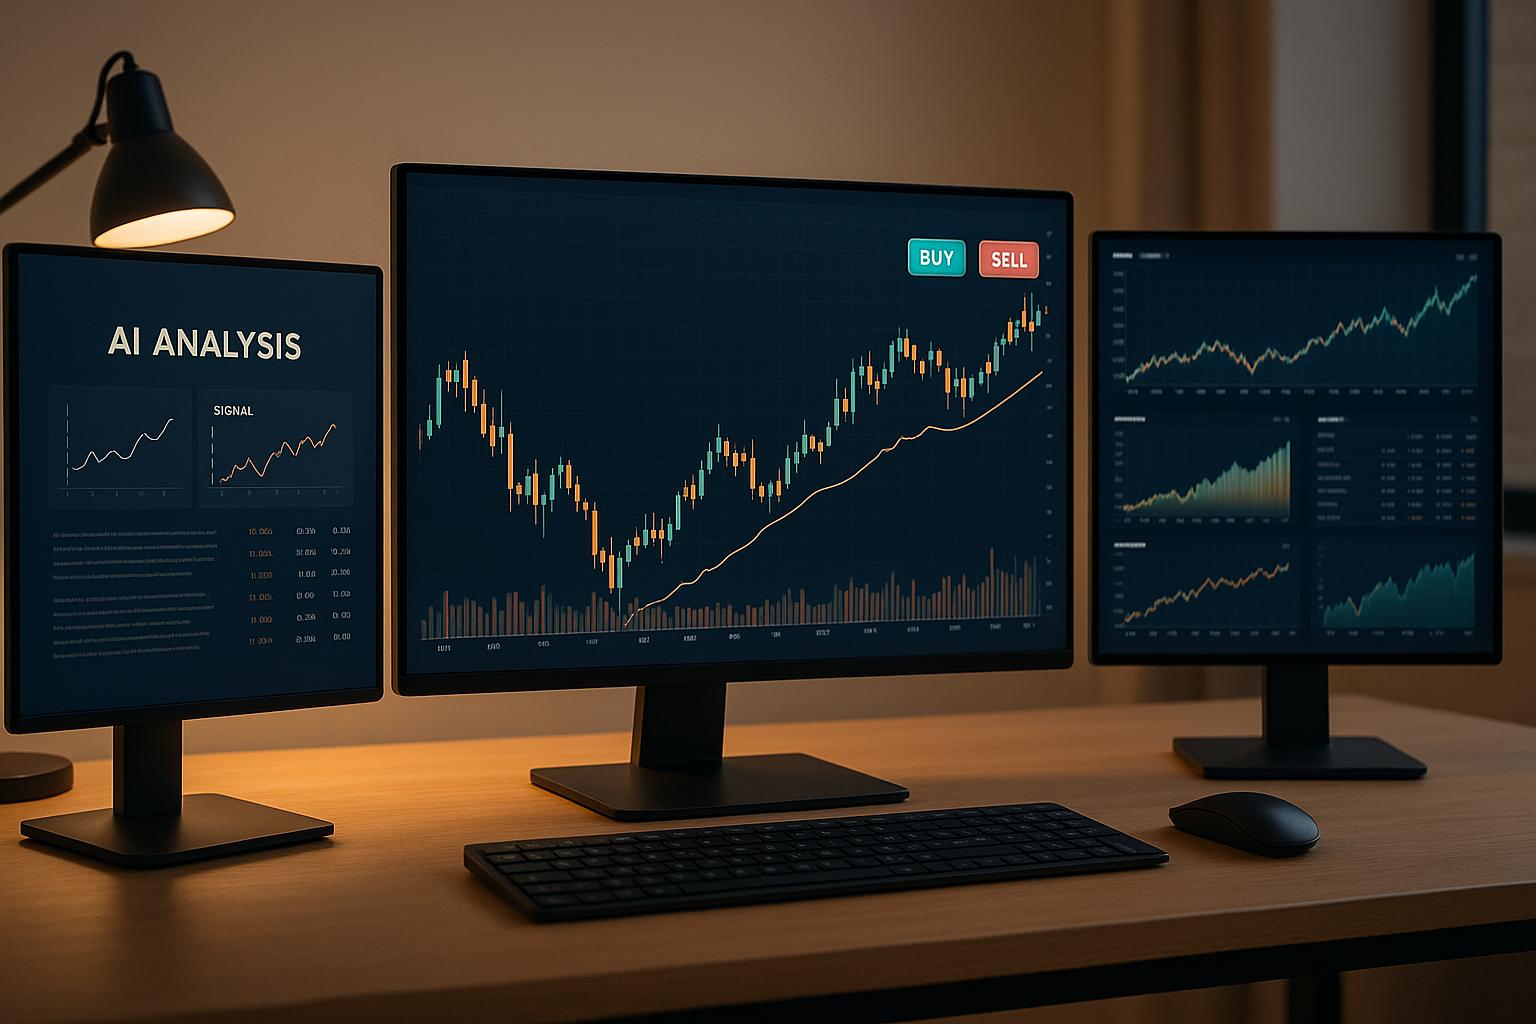
Real-time AI trading signals provide instant Buy, Sell, or Hold recommendations by analyzing live market data, historical trends, and sentiment from news or social media. These signals allow traders to act quickly on market changes, offering entry prices, stop-loss levels, and profit targets. Platforms like StockioAI process vast data streams in milliseconds, helping traders navigate fast-moving U.S. stock and cryptocurrency markets with precision.
Key Takeaways:
- AI signals analyze price, volume, order books, and sentiment in real-time.
- They work faster than humans, detecting market shifts within milliseconds.
- StockioAI offers tools like risk calculators, pattern recognition, and interactive dashboards for actionable insights.
- Signals include confidence levels, timeframes, and trade setups (entry, stop-loss, take-profit).
How AI Finds the Best Trades for You (91% Win Rate Example!)
How Real-Time AI Signals Are Generated

Data Sources and Inputs
Real-time AI trading signals are built on a foundation of constant data collection from various sources. These systems gather essential market data like price points (open, high, low, close, and individual tick movements), trading volume, and order book depth, which includes layers of buy and sell orders. For U.S. stocks, this data flows in during market hours (9:30 a.m.–4:00 p.m. ET), while cryptocurrency markets operate 24/7, streaming data from exchanges around the globe.
In addition to price and volume, AI systems track volatility indicators such as the Average True Range (ATR) and intraday standard deviation to measure price fluctuations. News feeds and social media platforms are also tapped through APIs, with natural language processing (NLP) tools analyzing the content to determine sentiment - whether the tone of headlines is positive, negative, or neutral. All of this data is synchronized, cleaned, and normalized to ensure it’s ready for AI analysis. StockioAI integrates these elements with advanced pattern recognition to pinpoint trading opportunities across different timeframes.
With this solid data framework in place, specialized algorithms take over to turn raw information into actionable insights.
AI Models and Algorithms
Once the data is prepped, machine learning and deep learning models come into play. Supervised learning models, like gradient boosting and random forests, are trained on historical price data to predict short-term trends. These models evaluate features such as moving averages, Relative Strength Index (RSI), and unusual volume spikes, identifying patterns that have historically led to profitable trades.
Deep learning methods, including recurrent neural networks (RNNs) and long short-term memory (LSTM) networks, tackle more complex, non-linear relationships in time-series data. These models excel at recognizing shifts in market behavior and adapting to different trading environments. Meanwhile, convolutional neural networks (CNNs) are employed to scan chart patterns like breakouts, double tops, and flags by analyzing chart images. Natural language processing models further enhance predictions by converting unstructured text - such as earnings reports, Federal Reserve updates, or cryptocurrency news - into sentiment scores that feed directly into the prediction engine. StockioAI combines these approaches with its pattern-recognition tools to uncover precise trading opportunities across multiple timeframes.
Once predictions are made, a streamlined process converts these insights into actionable trading signals.
Processing Pipeline for Real-Time Signals
The process of generating real-time trading signals involves four key steps: data ingestion, feature computation, model inference, and signal formatting. First, the system captures live market data using APIs from exchanges and data providers, recording every price tick and trade. Next, an analytics layer calculates features over rolling time windows - such as returns from the last 5, 15, or 60 minutes, order book imbalances, volatility spikes, and sentiment changes - preparing the inputs for AI models.
During the model inference phase, trained algorithms analyze the updated data, producing probabilities or forecasts. For instance, the system might predict a 78% likelihood that a price will rise by 0.5% in the next 15 minutes. In the final step, these raw outputs are transformed into clear trading signals. If the probability surpasses a set threshold, like 0.7, the system issues a Buy signal. For expected price declines, it recommends a Sell, and for neutral forecasts, a Hold. Each signal includes details like suggested entry prices, stop-loss levels, and take-profit targets, all tailored to recent volatility and key support or resistance levels. This efficient pipeline ensures traders receive timely and actionable insights.
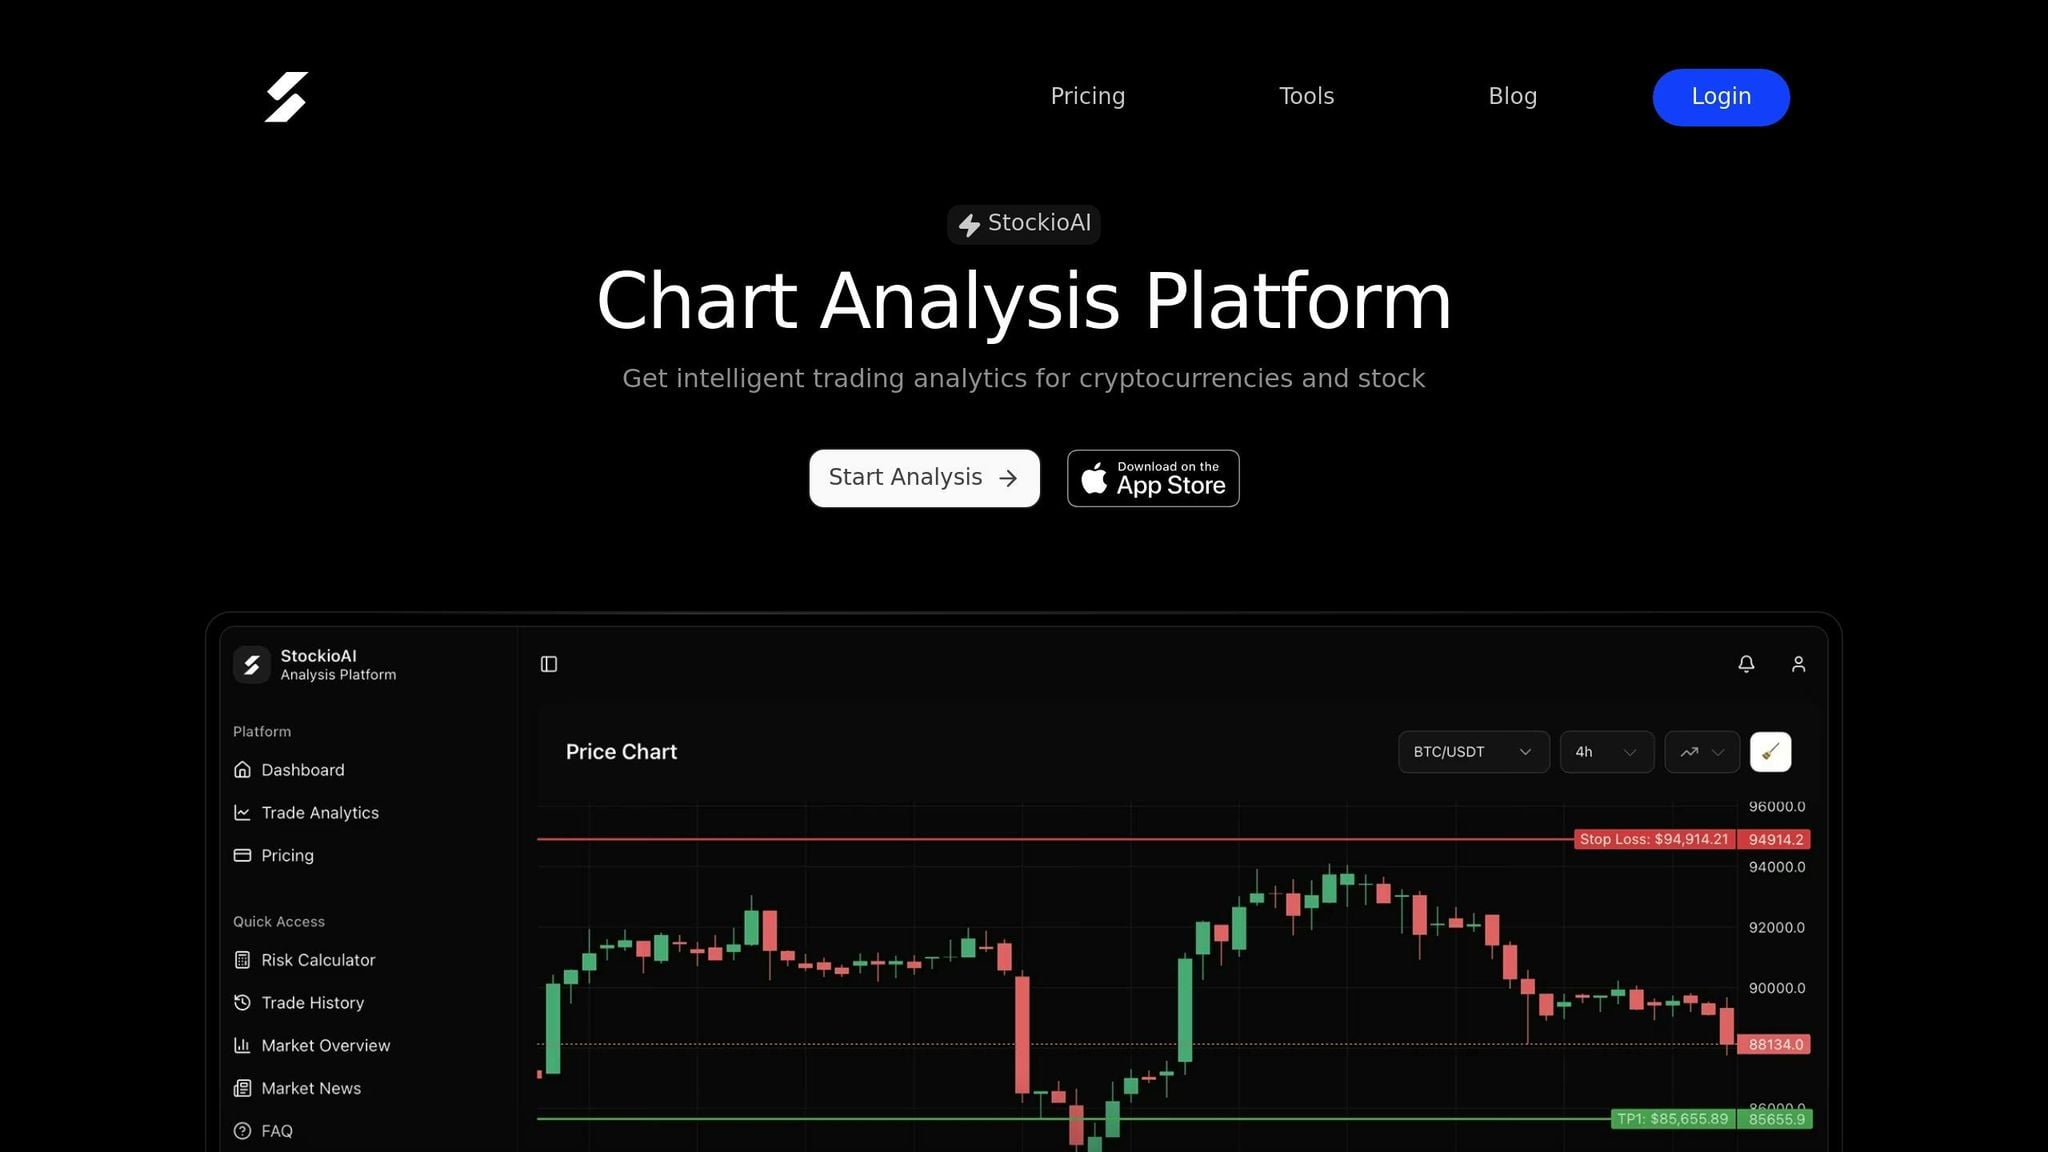
StockioAI displays these signals as color-coded markers on interactive charts, continuously updating to help traders respond quickly during volatile moments. Research from Exegy highlights the importance of speed, noting that 66% of U.S. equity trading volume happens within 50 milliseconds of a National Best Bid and Offer (NBBO) price change [3]. By processing data and running models in milliseconds, AI systems give traders the edge they need to act on opportunities before they vanish, turning intricate data streams into straightforward, real-time recommendations.
How to Interpret and Use Real-Time AI Signals
Once advanced AI algorithms generate trading signals, the next step is interpreting them quickly and effectively to make informed decisions.
Understanding Signal Components
AI trading signals are packed with key details that guide your actions. First, the asset name specifies what you're trading - whether it's a stock like AAPL or a cryptocurrency pair like BTC/USD. The direction indicates the suggested move: Buy, Sell, or Hold. A confidence score, typically a percentage (e.g., 85% or 92%), reflects the likelihood of success. The timeframe tells you which chart interval the signal applies to, such as 15-minute or daily charts[1][4].
Signals also include trade setup details, such as a suggested entry price (e.g., $150.00), a stop-loss level ($145.00), and a take-profit target ($160.00). These values are calculated based on recent market activity and key support or resistance levels. For instance, a signal reading "AAPL - Buy - 92% confidence - 15-minute timeframe - Entry: $150.00, Stop-Loss: $145.00, Take-Profit: $160.00" provides all the information needed to execute a trade with clear risk parameters[1][4].
High-confidence signals (80–90% or higher) indicate stronger setups, while those in the 60–80% range require more caution. Signals below 60% are generally better suited for holding positions. Research shows that ignoring signals with less than 75% confidence can reduce losses by 20–30% in volatile markets[1][2][4].
To refine your strategy further, consider how signals align across multiple timeframes.
Multi-Timeframe Analysis in Signal Interpretation
Aligning signals across different timeframes can significantly improve their reliability. For example, a Buy signal on a 15-minute chart gains more credibility when the 1-hour and daily charts also show upward momentum. This approach helps filter out short-term market noise and reduces the risk of conflicting trades.
Take BTC/USD as an example: if a 5-minute chart shows a 78% Sell signal but the 4-hour chart displays a 91% Buy signal, the higher timeframe typically holds more weight. Experts note that using this method can cut conflicting trades by up to 40%, helping preserve capital during volatile periods[2][4][6].
By requiring confluence - agreement across multiple timeframes - trading accuracy can improve by 15–25%. For instance, ignoring a short-term Buy signal that contradicts a long-term downtrend can save you from unnecessary losses. Waiting for the charts to align ensures a more consistent strategy[1][3][5].
StockioAI simplifies this process, making multi-timeframe validation seamless and efficient.
Using StockioAI for Signal Interpretation
StockioAI offers tools that make interpreting and validating signals straightforward. Its interactive charts allow you to zoom across timeframes instantly, enabling you to confirm Buy, Sell, or Hold signals without juggling multiple screens. The platform’s multi-timeframe indicators overlay signals directly onto your charts, so you can quickly check whether a 15-minute Buy signal aligns with hourly trends or daily support levels.
Additionally, StockioAI’s AI-powered pattern recognition detects chart formations like head-and-shoulders, flags, and triangles, assigning confidence scores to each pattern. For example, it might highlight a "Bullish engulfing on ETH/USD, 89% Buy" and link it directly to the signal. This automated analysis captures setups that manual methods often miss - studies show traders overlook nearly 40% of profitable patterns when analyzing charts manually[5].
The platform’s color-coded markers display essential details such as entry points, stop-loss levels, take-profit targets, and risk-reward ratios. These markers update continuously during market hours (9:30 a.m.–4:00 p.m. ET for U.S. stocks) and operate 24/7 for cryptocurrencies, ensuring you can act quickly during fast-moving markets. With StockioAI, you can transition from analysis to execution with confidence and speed.
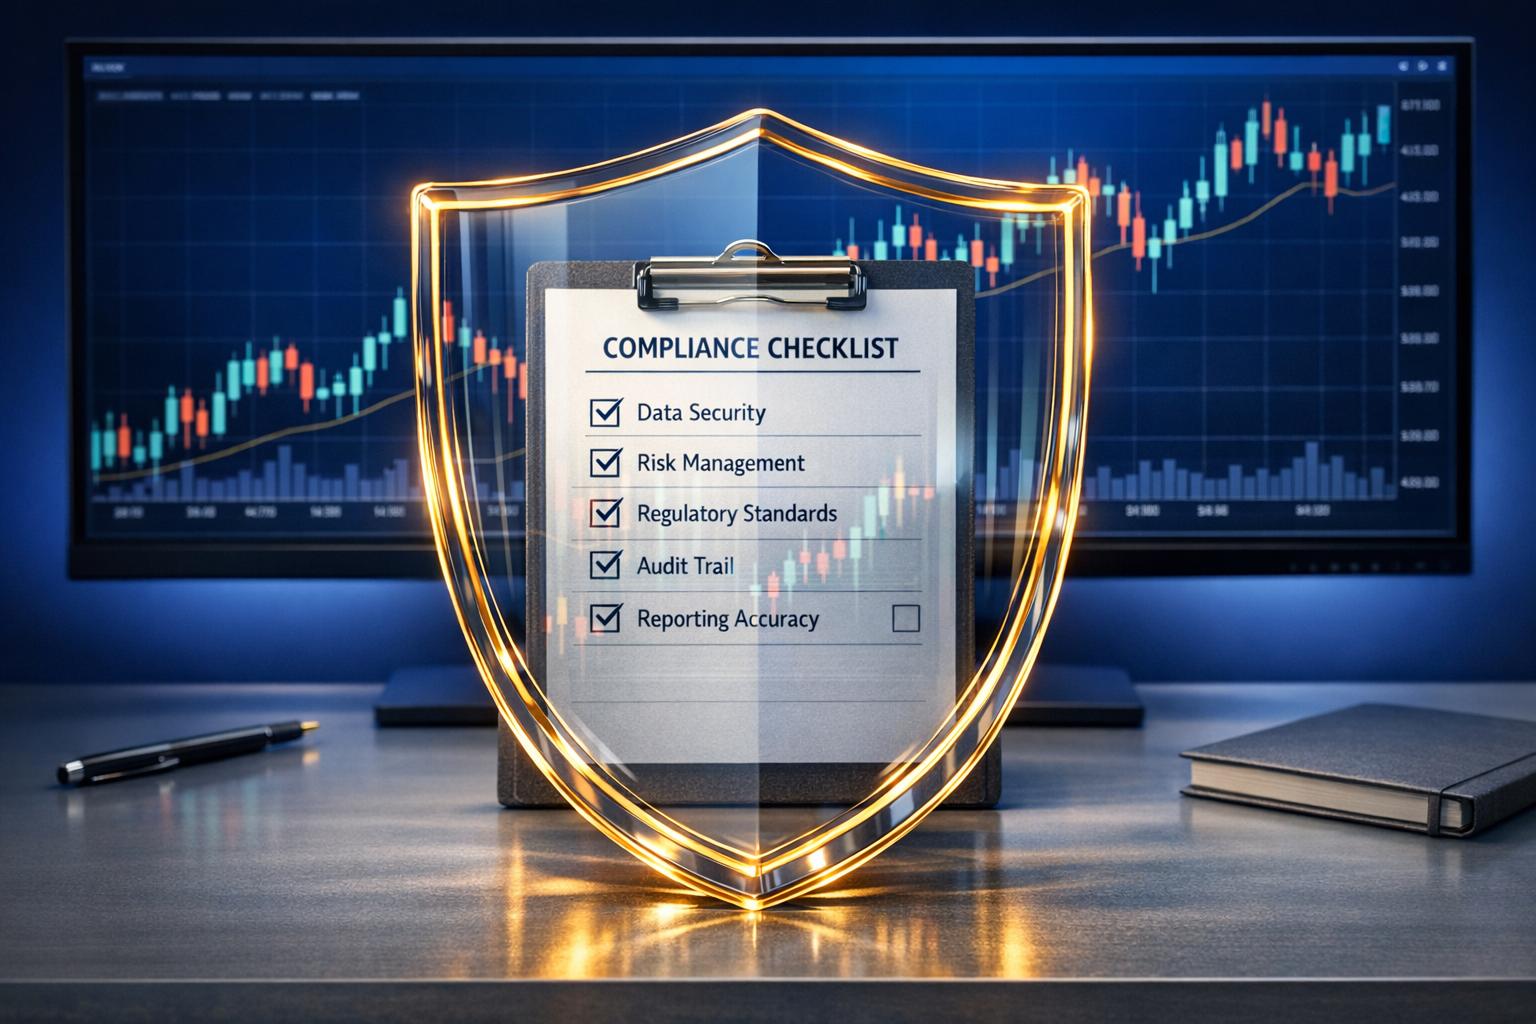
Risk Management When Using Real-Time AI Signals
While AI signals can improve your trading probabilities, they don’t eliminate market risk. A common misconception among U.S. retail traders is that AI signals are inherently "safer" or guarantee profits. In reality, they simply tilt the odds in your favor, but the inherent risks of trading remain [1][7]. The speed and frequency of real-time signals can amplify both gains and losses, making disciplined risk management absolutely critical. By implementing strong risk management practices, you can maximize the benefits of AI-driven trading while keeping potential losses in check.
Position Sizing and Risk Limits
Effective risk management starts with controlling how much you risk on each trade. Many traders use percentage-based risk, where you allocate a set percentage of your account - typically 0.5% to 2% - to each trade. For example, with a $25,000 account and a 1% risk level, your maximum loss per trade would be $250. If a signal suggests entering at $50.00 with a stop-loss at $47.50 (a $2.50 per share risk), you would buy 100 shares ($250 ÷ $2.50 = 100).
Alternatively, fixed dollar risk keeps things simple by setting a consistent dollar amount per trade, such as $100, regardless of small fluctuations in your account balance. Tools like StockioAI’s risk calculators can help you quickly determine the appropriate position size by factoring in your account size, risk tolerance, entry price, and stop-loss level. This ensures consistency, even during volatile trading sessions.
Beyond individual trades, many traders set daily and weekly loss limits to avoid emotional decision-making after a losing streak. For instance, you might stop trading for the day if your losses hit 2–3% of your account balance (e.g., $500–$750 on a $25,000 account) or for the week if losses reach 4–6%. These limits help protect your capital and prevent one bad day or week from derailing your long-term strategy.
Stop-Loss and Take-Profit Strategies
Stop-loss orders are essential for managing downside risk. By combining AI volatility metrics with technical levels, you can set stops that account for normal price fluctuations while protecting against larger losses. For example, using the Average True Range (ATR), you might place stops 1.5–2× ATR away from your entry point. Pairing this with technical levels like recent swing lows, support zones, or moving averages can reduce the likelihood of being stopped out by routine market noise.
When StockioAI suggests a trade, review the AI-recommended stop-loss zone, compare it with ATR values and chart patterns, and choose a level that aligns with your risk tolerance. For take-profit targets, aim for at least a 2:1 reward-to-risk ratio (e.g., risking $100 to target $200). StockioAI may also suggest multiple profit targets, such as a partial exit at 1.5× risk and a final exit at 3× risk. This approach allows you to lock in some gains while leaving room to capture larger moves. In strong trends, you can use trailing stops based on volatility bands or moving averages to maximize potential profits.
To streamline execution, translate signals into a bracket order: one entry order paired with a stop-loss and one or more take-profit orders. For example, if StockioAI signals a buy at $50.00, you might place a limit buy near $50.00, a stop-loss at $47.50 (risking $2.50 per share), and profit targets at $55.00 and $60.00. Once your trade is active, your broker’s order management system can automatically close the position when the stop or a target is hit, reducing the need for constant monitoring and minimizing emotional interference.
Adapting Signals to Market Conditions
Fixed risk strategies are a good starting point, but adapting to different market conditions can improve your outcomes. In trending markets, consider using wider stops based on 2–3× ATR and slightly reducing position sizes. This approach allows you to stay in the trade longer while respecting your overall risk limits. Take-profit targets can also be more flexible, with trailing stops helping you ride the trend.
In ranging markets, tighter stops are usually more effective. Place them just outside the range boundaries and use modest position sizes, with profit targets set near the opposite side of the range. This aligns well with mean-reversion strategies, which complement AI signals that detect oscillations.
Volatile markets call for extra caution. Reduce position sizes by 30–50% and consider skipping marginal signals, as large price swings can quickly trigger stops and targets. If StockioAI identifies a high-volatility regime, you might adopt a "risk reduction" profile, which involves lowering your per-trade risk, widening stops only when position sizes are adjusted, and setting higher reward-to-risk thresholds.
Major scheduled events, such as Federal Reserve announcements or key earnings reports, often cause unpredictable price behavior. To minimize risk during these periods, traders might halve position sizes, avoid entering new trades just before or after the event, or wait until the initial market reaction stabilizes. This approach prevents overconfidence in AI signals during abnormal conditions and helps preserve capital for more stable opportunities.
Keeping a detailed risk journal is another valuable practice. Record key details for each AI-driven trade, such as entry and exit prices, stop and target levels, position size, market conditions (trending, ranging, or volatile), and the resulting profit or loss relative to the initial risk. Regularly reviewing this data, along with StockioAI’s performance analytics - such as win rates, average reward-to-risk ratios, and drawdowns - can help you refine your strategies and adapt to different market environments effectively.
Conclusion
As outlined above, combining real-time AI signals, advanced data analytics, and disciplined risk management can significantly improve trading performance.
How Real-Time AI Signals Help Traders
Real-time AI signals empower traders to make quicker, more informed decisions while minimizing emotional bias. In U.S. equities and cryptocurrency markets, these signals rely on objective, backtested rules rather than gut instincts. This approach helps traders avoid emotionally charged decisions, like panic-selling during market dips or chasing gains during surges. The result? A more structured and consistent trading strategy that prioritizes risk-reward balance for every trade in USD.
AI systems also operate around the clock, analyzing markets continuously and adapting to changing conditions. This ensures that no overnight or pre-market movements are missed, giving traders an edge in responding to market shifts. Together, these features create a reliable framework that integrates seamlessly with advanced trading platforms.
StockioAI: A One-Stop Trading Platform
StockioAI takes these benefits a step further by offering an all-in-one platform designed to simplify the trading process. It provides real-time signals, interactive charting, AI-driven pattern recognition, and built-in risk management tools. Traders can use StockioAI to validate signals against technical levels, calculate position sizes in dollars, set stop-loss and take-profit targets, and monitor performance analytics - all within a single platform. This eliminates the need to juggle multiple tools, making trading more efficient and streamlined.
FAQs
What makes real-time AI trading signals different from traditional ones?
Real-time AI trading signals bring a fresh edge to the trading world by leveraging advanced machine learning to process live market data non-stop. Unlike traditional signals, which depend heavily on historical data and manual analysis, AI-driven signals deliver immediate and precise recommendations - whether it’s to buy, sell, or hold.
This instant feedback allows traders to respond swiftly to market shifts, spotting trends and patterns that older methods might overlook. By keeping pace with ever-changing market conditions, these signals help traders make quicker, smarter decisions.
How does sentiment analysis contribute to generating AI trading signals?
Sentiment analysis is a powerful tool in creating AI-driven trading signals. It works by assessing the general mood and emotions circulating in the market. By sifting through data from news articles, social media platforms, and other sources, it uncovers trends in investor sentiment that could impact price movements.
This approach enhances the precision of buy, sell, or hold recommendations, giving traders the ability to make decisions grounded in both technical insights and an understanding of market psychology.
How can traders use AI signals to manage risk effectively?
Traders can navigate risks more effectively by pairing AI-generated signals with solid risk management techniques. This means leveraging tools like position sizing calculators to figure out the ideal trade size, setting stop-loss levels to cap potential losses, and cross-checking signals with AI-driven insights to boost confidence in their choices.
Platforms such as StockioAI offer features like risk calculators and technical analysis tools, empowering traders to refine their strategies, reduce risks, and make smarter trading decisions.