Crypto trading requires precision, especially in a market that never sleeps. To help traders make informed decisions, AI-powered tools like StockioAI analyze over 60 real-time data points every second. These tools allow customization of key signal parameters, improving accuracy and aligning with individual trading strategies.
Here are the 7 most critical parameters to optimize for better results:
- Relative Strength Index (RSI): Adjust thresholds (e.g., 70/30 to 80/20) and periods for better overbought/oversold signals.
- Moving Averages (SMA/EMA): Fine-tune periods (e.g., 50-day vs. 200-day) to identify trends and crossovers.
- Bollinger Bands: Modify period length and standard deviation to suit market conditions.
- MACD: Adjust fast/slow EMA and signal line periods to refine momentum signals.
- Support and Resistance Levels: Use dynamic levels for entry/exit points based on price action.
- Volume and Liquidity Filters: Set thresholds to avoid low-activity assets and improve trade reliability.
- Stop-Loss and Take-Profit: Customize exit levels to manage risk and secure profits.
These parameters, combined with AI tools, help traders reduce false signals, manage risk, and improve decision-making. Platforms like StockioAI simplify this process by offering tailored insights, confidence scores, and multi-indicator analysis. With plans starting at $49/month, even beginners can access advanced trading tools.
BEST TradingView Indicators & Tools for Crypto Trading (+Special Settings)
1. Relative Strength Index (RSI)
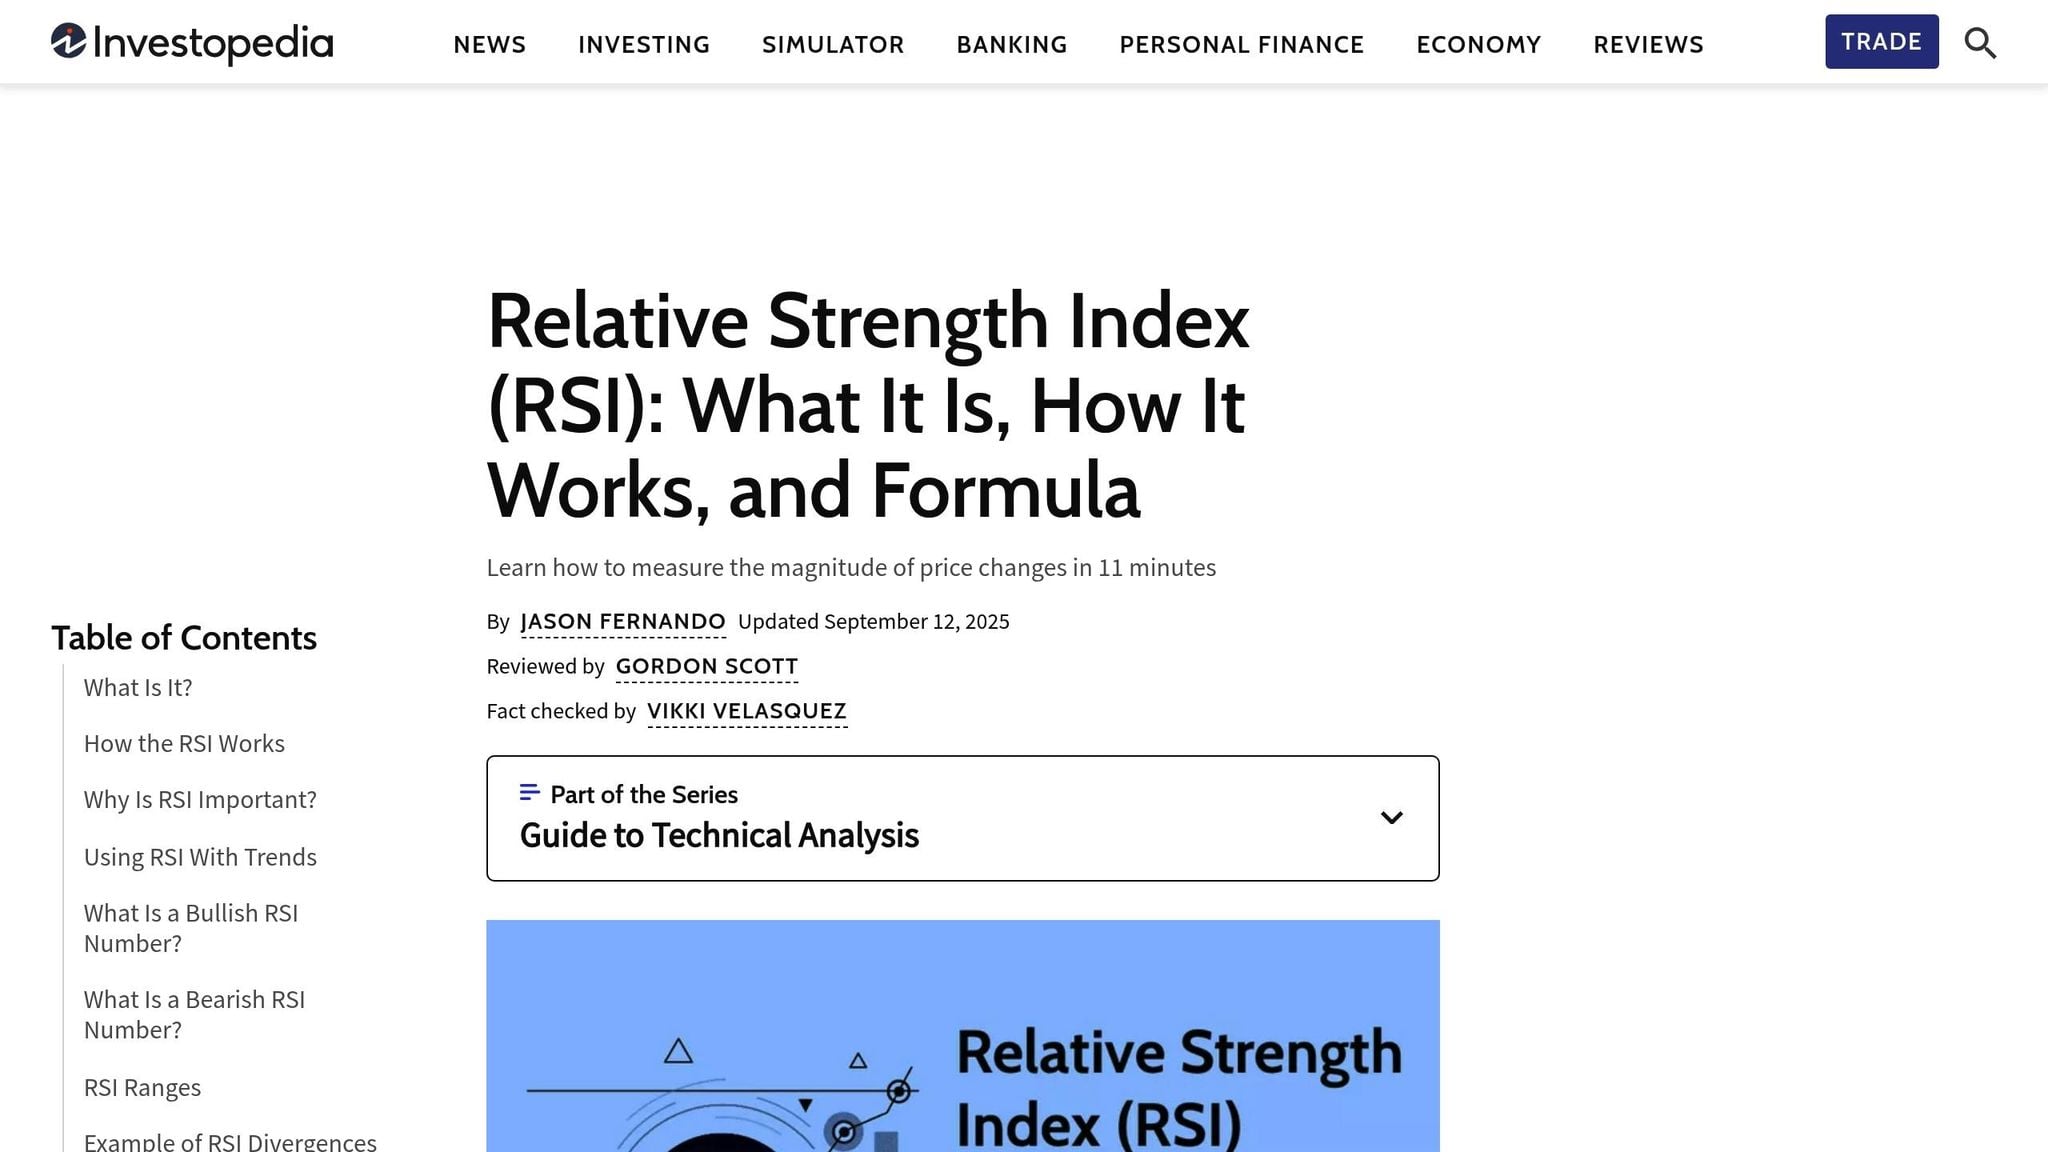
The Relative Strength Index (RSI) is a widely-used momentum oscillator in cryptocurrency trading, introduced by J. Welles Wilder Jr. in 1978. It measures price momentum on a scale of 0 to 100, helping traders identify when an asset may be overbought or oversold.
The formula for RSI is simple:
RSI = 100 - (100 / (1 + RS))
Here, RS refers to the average gain divided by the average loss over a chosen timeframe, often set to 14 periods[2].
Customizability
One of the standout features of RSI is how adaptable it is to different trading strategies. Traders can adjust the RSI period to fit their style - shorter periods like 7 or 9 for scalping, or longer ones like 21 or 28 for swing trading. Similarly, the standard overbought (70) and oversold (30) thresholds can be modified. For example, aggressive traders might shift these levels to 80/20 to filter out false signals in trending markets or use 60/40 in more stable, range-bound conditions. Analyzing RSI across multiple timeframes can also help align short-term trades with broader trends, providing a more precise approach.
Impact on Signal Accuracy
Fine-tuning RSI settings can significantly improve the reliability of trading signals. In the highly volatile crypto market, the traditional 70/30 thresholds may sometimes trigger false signals. Adjusting these levels - for instance, to 80/20 - can help reduce noise and enhance signal clarity. Combining RSI with other tools, like volume analysis or additional technical indicators, creates a more comprehensive and reliable trading framework.
Use Cases in Cryptocurrency Markets
RSI is particularly effective for identifying potential trend reversals. While the standard settings flag values above 70 as overbought and below 30 as oversold, traders often adapt these thresholds to match market conditions. For instance, in a strong uptrend, an RSI reading of 80 might indicate that an asset is overextended and due for a correction. Divergence analysis is another powerful use case - if prices continue to hit new highs while RSI does not, it may signal weakening momentum and a possible reversal. These insights can help traders time their entries and exits more precisely.
Relevance for Risk Management
RSI isn’t just about spotting trading opportunities; it’s also a valuable tool for managing risk. When an asset reaches extreme RSI levels, traders might take partial profits or tighten stop-loss orders to lock in gains. For example, StockioAI incorporates RSI into its risk management tools, offering stop-loss and take-profit recommendations based on momentum conditions. Dynamic stop-loss strategies, which adjust according to RSI readings, provide a more flexible way to navigate the unpredictable nature of cryptocurrency markets.
2. Moving Average Parameters (SMA/EMA)
Just like the RSI, moving averages are highly adaptable tools that enhance AI signal generation in trading. They’re essential for spotting trends and generating actionable insights in cryptocurrency markets. The two main types - Simple Moving Average (SMA) and Exponential Moving Average (EMA) - serve different purposes, depending on your trading style and the market's behavior.
The SMA calculates the average price over a set time frame, treating all data points equally. On the other hand, the EMA gives more weight to recent prices, making it quicker to react to market shifts.
Customizability
One of the biggest advantages of moving averages is their flexibility. You can tweak their parameters to match your trading objectives. The key adjustment is the period length:
- Shorter periods (e.g., 9 or 20 days) are ideal for active, short-term trading.
- Longer periods (e.g., 50, 100, or 200 days) are better for identifying broader trends.
You can also customize the input price, choosing from closing prices, opening prices, or even weighted averages of highs, lows, and closes. This adaptability allows moving averages to perform well in different market conditions:
- In trending markets, longer periods help filter out noise from short-term fluctuations.
- In sideways or range-bound markets, shorter periods are more effective at capturing smaller price movements.
Traders often combine multiple timeframes to gain both short-term and long-term perspectives, fine-tuning their strategies for greater precision.
Impact on Signal Accuracy
The choice between SMA and EMA - and how you configure their parameters - has a direct impact on the reliability of trading signals. The EMA’s sensitivity to recent price action makes it excellent for capturing quick market changes, which is especially useful in the fast-moving crypto world. However, this sensitivity can sometimes lead to false signals in choppy or unpredictable conditions.
A study by StockioAI found that pairing optimized moving average crossovers with AI analytics led to consistent monthly returns of 18% for certain users[2]. Shorter periods tend to generate more frequent signals, but these can be noisy. In contrast, longer periods produce fewer, more dependable signals, though they may lag behind the market. The 50-day and 200-day moving averages, in particular, have become go-to tools for spotting major trend reversals.
Use Cases in Cryptocurrency Markets
Moving average crossovers are some of the most practical signals in crypto trading. A popular example is the golden cross, where a short-term EMA (like the 50 EMA) moves above a long-term EMA (such as the 200 EMA). This often signals the start of a bullish trend. On the flip side, the death cross - when the short-term EMA drops below the long-term EMA - can point to bearish momentum[2].
But crossovers aren’t the only use for moving averages. They also act as dynamic support and resistance levels. In an uptrend, prices often bounce off rising moving averages. During a downtrend, these averages can serve as resistance, making it harder for prices to break through.
Relevance for Risk Management
Moving averages aren’t just trend indicators - they’re also key tools for managing risk. Many traders use them to set dynamic stop-loss levels. Instead of sticking to fixed percentages, stops can be placed just below important moving averages. This approach adjusts to current market volatility, offering more flexibility.
StockioAI incorporates moving average insights into its risk management system, helping traders decide when to hold, reduce, or close positions as trends and momentum evolve. By aligning stop-losses and position sizes with moving averages, traders can better navigate the ever-changing crypto landscape.
3. Bollinger Bands Settings
Bollinger Bands are a go-to tool for traders looking to adapt their strategies to market conditions. This technical indicator combines a moving average with two bands set at specific standard deviations above and below it. The bands naturally expand during periods of high volatility and tighten when the market calms down.
The default setup typically uses a 20-period simple moving average and 2-standard deviation bands. However, these settings aren’t set in stone - they can be adjusted to align with different trading styles and market environments.
Customizability
What makes Bollinger Bands so versatile is the ability to tweak three key parameters:
- Period Length: This defines how many data points the moving average considers. Shorter periods, like 10 or 15, make the bands more sensitive to recent price changes, generating more signals but also more noise. Longer periods, such as 50 or 100, smooth out the bands, making them less reactive.
- Standard Deviation Multiplier: This determines how far the bands extend from the moving average. While 2.0 is the standard, tighter bands (e.g., 1.5) generate more frequent signals, and wider bands (e.g., 2.5) help filter out market noise.
- Timeframe: The timeframe of your chart also matters. For example, 1-hour charts are more suited for day trading, while daily charts work better for longer-term swing trading.
| Setting | Typical Value | Customization Impact |
|---|---|---|
| Period Length | 20 | Shorter = more signals, more noise |
| Standard Deviation | 2 | Lower = tighter bands, more signals |
| Timeframe | 1h, 4h, 1d | Shorter = more responsive |
By adjusting these parameters, you can align the indicator with your trading goals and market conditions.
Impact on Signal Accuracy
How you configure Bollinger Bands directly influences the signals you get. Tighter bands might produce more frequent trading signals but can lead to false positives, especially in choppy markets. On the other hand, wider bands help reduce noise and false signals but might cause you to miss some valid opportunities.
In the volatile world of cryptocurrency trading, finding the right balance is key. Many traders start with the default settings and fine-tune them based on the specific cryptocurrency they are trading and the current market environment.
Use Cases in Cryptocurrency Markets
Bollinger Bands are more than just a tool for tweaking settings - they’re also incredibly useful for market analysis. For instance:
- When prices touch or break the upper band, it often indicates overbought conditions.
- Contact with the lower band suggests oversold conditions.
- In strong trends, prices can "walk the bands", staying near the upper or lower band for extended periods.
Another valuable pattern is the band squeeze, where the bands contract significantly. This often signals that a major price move is on the horizon, making it a useful warning for potential breakouts. Conversely, extremely wide bands usually indicate heightened volatility, which often settles down afterward.
Traders also use the middle line (the moving average) as dynamic support or resistance. In an uptrend, prices often bounce off this line, while in a downtrend, it can act as resistance.
Relevance for Risk Management
Bollinger Bands aren’t just about spotting opportunities - they’re also a powerful tool for managing risk. By adjusting to market volatility, they allow for more dynamic strategies. For example, instead of setting a fixed stop-loss percentage, you could place your stop just below the lower band when holding a long position.
The width of the bands also acts as a built-in volatility gauge. Wider bands suggest higher volatility, which might prompt you to reduce your position size. Narrower bands, on the other hand, could allow for larger positions.
Quantitative traders using platforms like StockioAI have reported improved returns and better risk management through AI-optimized Bollinger Bands settings. One user noted an 18% monthly return after incorporating AI-driven adjustments into their strategy, highlighting how real-time parameter optimization and multi-indicator analysis can help navigate the volatile crypto market[2].
StockioAI takes Bollinger Bands to the next level by integrating them with other technical indicators and AI-driven pattern recognition. This approach enables traders to adapt dynamically to changing market conditions, avoiding the pitfalls of static settings in the ever-shifting cryptocurrency landscape.
4. MACD Configuration
The Moving Average Convergence Divergence (MACD) indicator is a tool that helps traders understand the relationship between two moving averages of a cryptocurrency's price. By measuring the difference between a fast and a slow exponential moving average (EMA) and overlaying a signal line, MACD identifies potential entry and exit points based on market momentum.
The standard MACD setup uses three key parameters: a 12-period fast EMA, a 26-period slow EMA, and a 9-period signal line. While these default settings are widely used, they aren’t one-size-fits-all. Traders can adjust these parameters to suit different trading styles and market conditions, making MACD a versatile tool.
Customizability
What makes MACD so adaptable is the ability to tweak its three main parameters:
-
Fast EMA period: This determines how quickly the indicator reacts to price changes. Shorter periods (8–10) make the MACD more sensitive to recent price movements, which can generate early signals but also increase false positives. Longer periods (15–20) smooth out noise, resulting in fewer but more reliable signals.
-
Slow EMA period: This serves as the baseline for identifying trends. While the standard setting is 26, day traders often shorten it to 20–21 for quicker trend detection. On the other hand, swing traders might extend it to 30–35 for a steadier trend confirmation.
-
Signal line period: This controls how often crossover signals occur. A shorter period (6–7) generates more frequent opportunities, while longer settings (12–15) filter out minor fluctuations, focusing on stronger momentum shifts.
| Parameter | Standard Setting | For Day Traders | For Swing Traders |
|---|---|---|---|
| Fast EMA | 12 | 8-10 | 15-20 |
| Slow EMA | 26 | 20-21 | 30-35 |
| Signal Line | 9 | 6-7 | 12-15 |
Impact on Signal Accuracy
Tweaking MACD parameters is all about finding the right balance between generating frequent signals and ensuring their reliability. Tighter settings can generate more signals but are prone to false positives, especially in choppy, sideways markets. Looser settings, while reducing noise, may lag in responding to sudden shifts in momentum - a common feature of altcoin movements.
In the highly volatile crypto markets, slightly faster settings often work better than the traditional configurations used for stocks. Cryptocurrencies tend to exhibit sharper price movements, and quicker signals can help traders react in time to protect or capitalize on positions.
Use Cases in Cryptocurrency Markets
The MACD indicator is particularly useful in several crypto trading scenarios:
- Bullish crossovers: When the MACD line crosses above the signal line, it often signals upward momentum.
- Bearish crossovers: When the MACD line drops below the signal line, it suggests potential downward movement.
- Divergence patterns: These occur when the price trend and MACD trend diverge, offering valuable insights. For instance, if Bitcoin’s price hits new highs but the MACD doesn’t follow, it may indicate weakening momentum and a potential reversal. Conversely, if the price makes lower lows while the MACD shows higher lows, it could signal underlying strength.
- Zero-line crossovers: When the MACD crosses above zero, it confirms bullish momentum, while crossing below zero indicates bearish conditions.
Relevance for Risk Management
MACD isn’t just about identifying entry points - it’s also a powerful tool for managing risk. The histogram, which represents the difference between the MACD line and the signal line, helps gauge the strength of momentum. A weakening histogram can serve as an early warning of potential reversals before they appear on the price chart.
Divergences in MACD also act as a signal for traders to adjust their positions. For instance, if a trader is holding a long position and notices bearish divergence in the MACD, it might be time to tighten stop-losses or reduce exposure, even if the price hasn’t started to drop yet.
A quantitative trader using StockioAI reported achieving consistent 18% monthly returns by customizing MACD settings for high-volatility altcoins. By shortening the fast and slow EMA periods, the trader captured more timely entry and exit points, while the platform’s AI filtered out low-confidence trades, reducing drawdowns and improving overall performance[2].
StockioAI takes MACD to the next level by combining it with over 60 real-time data points, such as volume trends, whale activity, and market sentiment. This layered approach helps eliminate false signals that might occur when relying on MACD alone, providing traders with more dependable insights in the fast-moving world of crypto trading[1].
5. Support and Resistance Levels
Support and resistance levels are key price points where crypto assets often slow down, reverse, or break through. Think of support as a "floor" where buying pressure typically steps in to stop further price drops, while resistance acts as a "ceiling" where selling pressure tends to cap upward movement. These levels play a central role in technical analysis, helping traders decide when to enter or exit the market. They also serve as a critical foundation for refining how AI tools enhance signal precision.
What makes these levels even more interesting is their dynamic nature - they shift as market conditions change. AI-driven platforms analyze historical price data, trading volumes, and patterns across different timeframes to pinpoint these zones. With this real-time insight, traders can better predict where buying or selling activity might intensify.
Customizability
Modern AI trading platforms allow traders to fine-tune how support and resistance levels are identified. For instance, users can adjust the sensitivity of detection to match their trading approach. High sensitivity might reveal smaller, short-term levels that day traders can leverage, while lower sensitivity highlights broader, long-term zones preferred by swing traders.
Timeframe selection is another critical factor. A level that seems significant on a shorter timeframe might hold less weight over a longer period. Volume confirmation settings further improve accuracy by ensuring that only levels backed by substantial trading activity are flagged.
Impact on Signal Accuracy
Support and resistance levels play a big role in sharpening AI-generated trading signals. For example, when Bitcoin approaches a strong resistance level, an AI system can factor this into its analysis, potentially signaling caution or suggesting an exit. The reliability of these levels can vary between cryptocurrencies. Major assets like Bitcoin and Ethereum often respect these zones more consistently due to their higher liquidity and trading volume, while smaller altcoins may see more unpredictable price movements or false breakouts.
AI systems adapt to these nuances by tailoring their algorithms to the unique behavior of each cryptocurrency, ensuring more dependable signals across varied market conditions.
Use Cases in Cryptocurrency Markets
Support and resistance levels are used in several trading strategies. In breakout trading, traders look for prices to push beyond established levels with strong trading volume - a sign that the trend may continue. For instance, if Ethereum breaks through a resistance level with increasing volume, it often indicates potential for further upward movement.
In range trading, these levels guide traders to buy near support and sell near resistance during periods of market consolidation. Repeated rejections at resistance or consistent holds at support can also signal potential trend reversals, offering valuable insights for decision-making.
Relevance for Risk Management
Support and resistance levels are essential tools for managing risk effectively. Traders use them to set stop-loss orders and determine position sizes based on the distance between the current price and nearby levels. This helps optimize trade sizes and limit potential losses.
Platforms like StockioAI take this a step further by processing over 60 real-time indicators, including support and resistance levels, to deliver actionable trading signals[3]. Its risk calculator enables traders to set stop-loss and take-profit levels tied to these zones, ensuring better capital protection and position sizing[3][2]. Additionally, StockioAI's multi-timeframe analysis provides a broader view of support and resistance zones, offering traders a more complete understanding of market dynamics[3][2].
6. Volume and Liquidity Filters
Expanding on the customizable indicators we talked about earlier, volume and liquidity filters play a key role in validating the strength of trading signals. These filters ensure that AI-generated signals only activate when market conditions support smooth and reliable trade execution. While volume measures market interest, liquidity reflects how easily trades can be executed without causing significant price changes - helping to minimize slippage.
These filters analyze factors like trading volume, order book depth, and overall market activity to confirm whether a price movement is backed by genuine market participation. Without adequate volume or liquidity, even the most promising technical setups can falter, making trade execution challenging. By continuously monitoring these metrics, AI platforms can filter out low-activity assets, reducing the risk of unexpected slippage or difficulties when exiting trades. Just like the customizable settings for technical indicators, these filters fine-tune the accuracy of AI-generated signals.
Customizability
AI platforms let traders adjust volume and liquidity thresholds to match their strategies. For instance, you can set a minimum daily trading volume - say, $5,000,000 - to focus only on assets with strong market participation. Similarly, you can define bid-ask spread limits, such as capping the spread at 0.5%, to avoid assets with wide price gaps between buyers and sellers. You can even customize order book depth requirements to ensure there’s enough liquidity to support your trade size. For example, setting a minimum 24-hour trading volume of $5,000,000 ensures you’re concentrating on assets with sufficient activity.
Impact on Signal Accuracy
Tailoring these thresholds enhances the reliability of trading signals by ensuring they are backed by real market activity. Volume and liquidity filters are particularly effective at eliminating false positives in thin markets. For instance, if a cryptocurrency shows a bullish technical pattern but lacks sufficient volume, the filter can block a premature buy signal. Adding volume confirmation boosts confidence in the signal by showing genuine market participation behind price moves[3].
These filters also help identify large-scale activity, such as institutional trades or whale movements, which often drive significant price changes. A sudden spike in trading volume, for example, can signal an impending price shift, allowing AI systems to adjust the timing and strength of their signals accordingly.
Use Cases in Cryptocurrency Markets
In the volatile world of cryptocurrency, volume and liquidity filters are essential for avoiding risky scenarios like pump-and-dump schemes, which often target low-volume altcoins. By enforcing minimum volume thresholds, these filters automatically exclude assets prone to manipulation. They’re also invaluable for traders handling large positions, ensuring trades don’t inadvertently disrupt the market.
During periods of high market volatility, these filters become even more critical. Traders can raise their volume requirements to focus on the most liquid assets, maintaining efficiency even as spreads widen in less active markets.
Relevance for Risk Management
Volume and liquidity filters are a cornerstone of solid risk management. They prevent trades in markets where liquidity is too low, reducing the risk of slippage and ensuring you can exit positions at favorable prices - especially during sudden market downturns. For automated trading strategies, aligning risk parameters with real-time market conditions is vital, and these filters make that possible.
Analyzing volume patterns across multiple timeframes provides additional insights. This helps distinguish between sustainable liquidity levels and temporary spikes, further improving signal reliability and protecting capital in volatile markets.
7. Stop-Loss and Take-Profit Levels
Stop-loss and take-profit levels are essential pieces of a complete risk management strategy in trading. These tools act as automated exit points, ensuring traders can protect their capital and lock in profits. A stop-loss order limits potential losses by automatically closing a position once it hits a predetermined threshold. Meanwhile, a take-profit order secures gains by selling when the price reaches a specified target.
Modern AI platforms analyze over 60 real-time market indicators to determine the best exit points, making these tools more precise than ever.[3]
Customizability
AI-powered platforms offer flexibility for setting stop-loss and take-profit levels, allowing traders to tailor these tools to their risk preferences and trading styles. Stop-loss distances can be set using fixed dollar amounts, percentage-based thresholds, or dynamic levels that adjust based on market volatility. For instance, you might choose a 5% stop-loss for a relatively stable asset like Bitcoin, while opting for an 8% threshold for more volatile altcoins.
StockioAI’s risk calculator takes into account factors like account balance, risk appetite, and market conditions to recommend optimal stop-loss distances and position sizes.[3][2]
Take-profit settings are just as adaptable. Traders can set multiple profit targets or use trailing stops, which adjust as prices move in their favor. Some prefer a conservative 1:1 risk-reward ratio, while others aim for a higher 1:3 ratio to maximize potential returns.
These customizable options make AI signals more reliable and actionable for traders.
Impact on Signal Accuracy
Well-tuned stop-loss and take-profit levels contribute to better signal accuracy by defining clear exit strategies. Incorporating these parameters into your trading plan can lead to improved outcomes. For example, platforms that integrate robust stop-loss and take-profit strategies have reported win rates as high as 75%, with profit factors reaching 2.95.[1]
Additionally, many AI systems provide confidence scores with their recommendations, helping traders align their exit strategies with the strength of the signal. This approach supports a variety of trading strategies, even in unpredictable market conditions.
Use Cases in Cryptocurrency Markets
Stop-loss and take-profit levels play distinct roles depending on the trading strategy. Day traders typically use tight stop-losses of 2-3% to manage rapid market fluctuations, while swing traders opt for wider stop-losses of 5-8% and set profit targets between 15-25% to capitalize on longer trends. For portfolio managers, consistent stop-loss rules help maintain discipline across multiple positions, with many adhering to the principle of not risking more than 2% of their total capital on a single trade.
During periods of extreme volatility, preset exit levels become even more critical. Events like flash crashes or sudden rallies can lead to impulsive decisions, but predefined stop-loss and take-profit orders help traders stay systematic and avoid emotional reactions.
Relevance for Risk Management
Stop-loss and take-profit orders are indispensable for managing risk in cryptocurrency trading. They translate a trader’s risk tolerance into clear, actionable rules, ensuring that emotions don’t cloud judgment during high-pressure situations. When paired with professional tools like risk calculators, these parameters form a robust risk management framework.[1]
Platforms like StockioAI further enhance this process by offering advanced tools that dynamically adjust exit strategies, providing an extra layer of support for active traders.
Parameter Comparison Table
Here's a breakdown of conservative and aggressive settings for key trading parameters, highlighting their trade-offs and how they impact trading strategies.
| Parameter | Conservative Setting | Aggressive Setting | Trade-offs |
|---|---|---|---|
| RSI Period | 21-day period | 7-day period | Longer periods reduce false signals but introduce lag; shorter periods react faster but add noise. |
| Moving Averages | 50/200-day SMA/EMA | 10/20-day SMA/EMA | Wider spreads filter out noise but may delay trend recognition; tighter spreads respond quickly but risk more whipsaws. |
| Bollinger Bands | 2.5 standard deviations | 1.5 standard deviations | Wider bands lower false breakout risks but may miss smaller moves; tighter bands capture more moves but increase false positives. |
| MACD Configuration | 12/26/9 standard | 5/13/5 fast | Standard settings confirm trends reliably; faster settings offer earlier signals but risk false entries. |
| Support/Resistance | Major levels only | All identified levels | Major levels reduce noise; including minor levels expands opportunities but requires careful filtering. |
| Volume Filters | High liquidity requirement | Low liquidity threshold | Strict filters ensure quality trades but limit opportunities; looser filters increase trade frequency with higher illiquidity risks. |
| Stop-Loss/Take-Profit | Wide stops (5–8%) | Tight stops (2–3%) | Wider stops allow for fluctuations but risk larger losses; tighter stops protect capital but may trigger premature exits. |
This table highlights the balancing act between conservative and aggressive settings, showing how each approach aligns with specific trading goals. Conservative parameters aim for higher accuracy by filtering out market noise, while aggressive parameters focus on capturing more opportunities but demand stricter risk management. StockioAI’s real-time analysis helps traders navigate these choices by leveraging signal confluence - waiting for multiple indicators to align before generating alerts. This reduces false positives while maintaining a steady flow of actionable signals[3][4].
Adapting to Market Conditions
Your parameter choices should align with market dynamics. For instance, in volatile periods, shorter indicator periods and tighter bands can help capture rapid price movements, though this may lead to more false signals in sideways markets. On the other hand, during stable market conditions, longer periods and wider bands can effectively filter out noise, focusing on significant trends and directional moves.
The Role of Backtesting
Backtesting is crucial when experimenting with parameter combinations. A strategy that works well for stable, high-cap cryptocurrencies might not perform as effectively with smaller, more volatile altcoins. Incorporating multi-factor, AI-driven signals - combining technical indicators, volume analysis, sentiment data, and on-chain metrics - can significantly improve accuracy and adaptability to changing market environments[4].
Tailoring Parameters to Your Trading Style
Success in parameter optimization comes down to understanding your trading style, risk tolerance, and market focus. For example, day traders often benefit from aggressive settings that provide frequent signals, while swing traders may lean toward conservative parameters that highlight larger, more meaningful price movements. By tailoring your approach to fit both your strategy and the market conditions, you can enhance the effectiveness of your trading decisions.
Conclusion
When it comes to crypto trading, success often hinges on how well you tailor your strategies to fit your unique trading style. From RSI settings to moving averages, Bollinger Bands, MACD, support and resistance levels, volume filters, and exit strategies, every parameter needs to align with your risk tolerance, trading frequency, and market goals. Mastering these tools isn’t about finding a universal formula - it’s about customization.
Take RSI periods, for example. Conservative traders might lean toward longer periods and wider Bollinger Bands to minimize market noise, while more aggressive traders may prefer shorter timeframes and tighter settings to capitalize on fast-moving opportunities. As highlighted in our parameter comparison table, there’s no one-size-fits-all approach. Your success depends on aligning these technical tools with your personal strategy and risk management plan.
This is where platforms like StockioAI change the game. By leveraging AI, StockioAI automates the process of adjusting parameters across more than 60 real-time indicators. These include technical analysis, volume patterns, sentiment data, and whale activity, all working together to deliver signals tailored to your preferences[3]. The platform simplifies decision-making by offering clearly defined entry points, stop-loss levels, and profit targets, complete with confidence scores.
What sets StockioAI apart is its multi-factor analysis. Instead of relying on a single indicator, it waits for multiple signals to align before triggering an alert. This reduces false positives and ensures more reliable, actionable opportunities[4].
According to user feedback, traders using AI-powered strategies have reported monthly gains of around 18%[2]. The ability to customize signals and risk settings makes these tools valuable for both beginners and seasoned traders, saving countless hours of manual chart analysis.
For those ready to streamline their trading, StockioAI offers plans to suit different needs. Starting at $49 per month for the Starter plan (30 signals monthly) and going up to $199 per month for the Enterprise plan (unlimited signals and custom AI training), the platform also includes a risk calculator to help you determine optimal position sizes and leverage based on your risk tolerance.
With these tools at your disposal, integrating AI into your trading approach becomes a smart step toward achieving your goals.
FAQs
How do customized parameters like RSI and moving averages enhance my crypto trading strategy?
Customizing tools like the Relative Strength Index (RSI) and moving averages gives you the flexibility to align trading signals with your specific strategy and the current market environment. These indicators are invaluable for spotting trends, gauging momentum, and pinpointing potential entry or exit points, helping you make more informed and precise decisions.
Tweaking these parameters to match your approach allows you to respond more effectively to market shifts. Platforms such as StockioAI offer advanced tools and analytics to fine-tune these settings, ensuring your trades are supported by reliable, actionable data.
How does AI improve trading signals and help manage risk in the fast-changing crypto market?
AI has become a game-changer in refining trading signals and managing risks in the unpredictable world of cryptocurrency. Through machine learning algorithms, it can sift through massive amounts of data, uncover patterns, forecast trend shifts, and pinpoint optimal moments to enter or exit trades.
Take platforms like StockioAI, for example. They use cutting-edge AI tools to offer traders features like interactive chart analysis, real-time risk evaluations, and accurate BUY, SELL, and HOLD signals. These tools enable traders to navigate volatile markets with confidence, making decisions based on data rather than guesswork.
How do volume and liquidity filters reduce trading mistakes and improve trade execution?
Volume and liquidity filters play a crucial role in helping crypto traders execute trades efficiently while minimizing risk.
Volume filters focus on assets with high trading activity, which helps reduce problems like slippage or challenges when entering or exiting positions. On the other hand, liquidity filters ensure there’s enough market participation - buyers and sellers - to enable smooth trade execution and avoid sudden price swings caused by low activity.
When applied effectively, these filters help traders zero in on assets that offer more stable trading conditions, reducing the chances of costly errors in unpredictable markets.