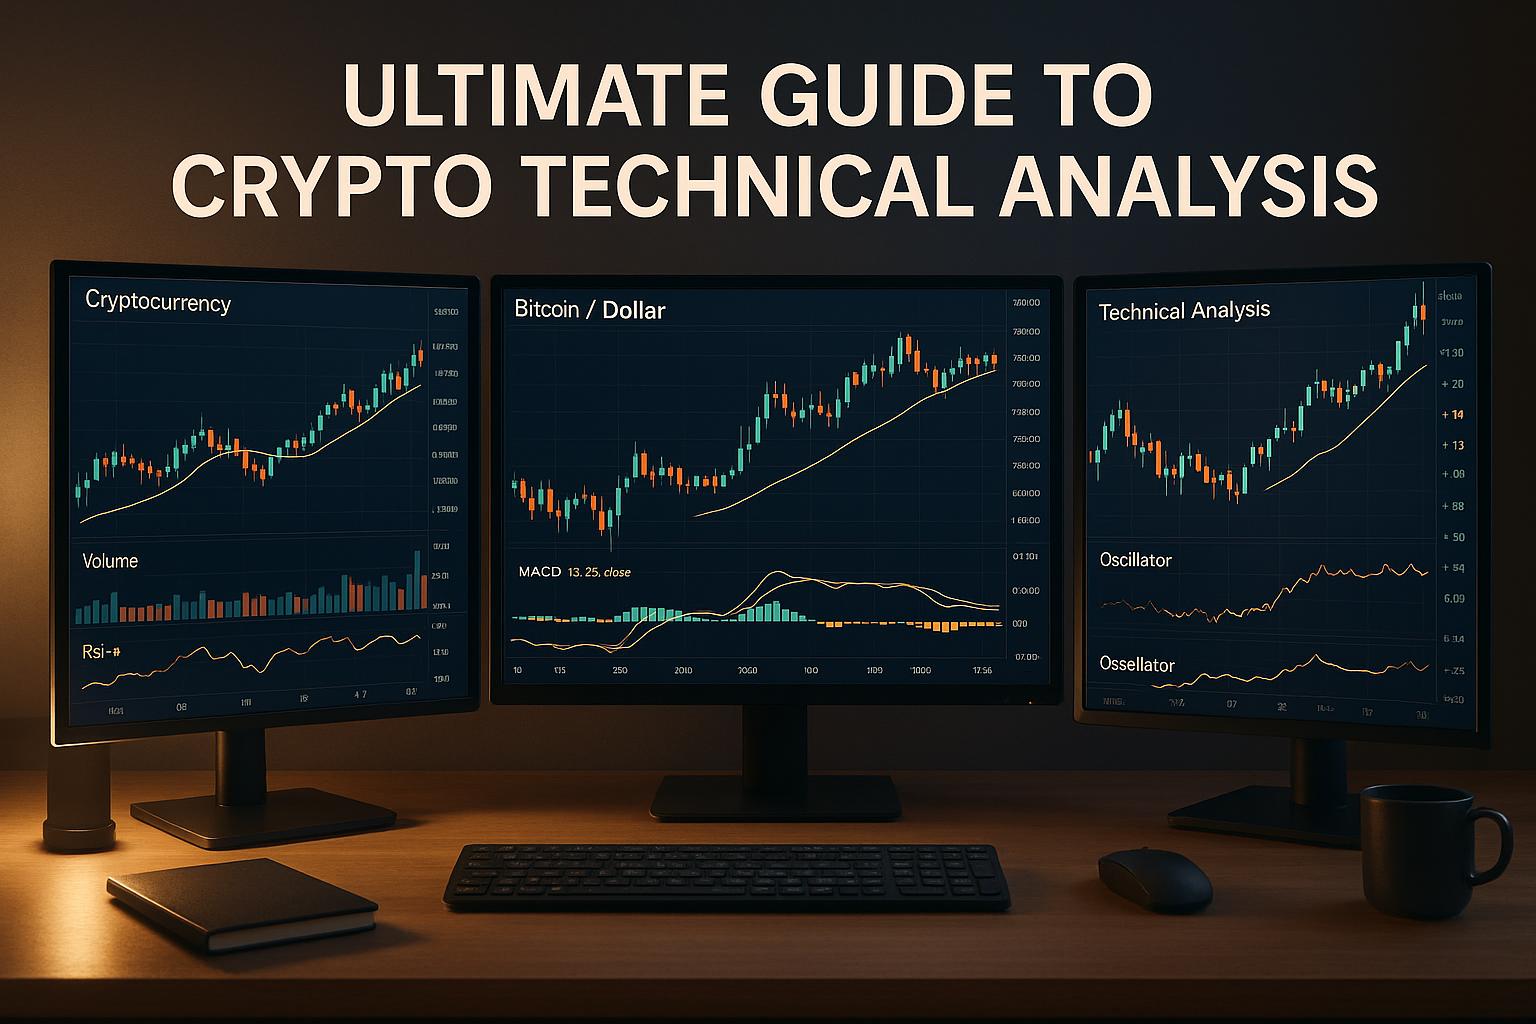
Want to master crypto trading? This guide simplifies technical analysis, showing you how to predict market trends, manage risks, and make smarter trades. Here's what you'll learn:
-
Chart Basics: How to read candlestick charts and spot trends.
-
Key Indicators: Moving Averages, RSI, and MACD explained for crypto.
-
AI Tools: Platforms like StockioAI that automate analysis and signals.
-
Risk Management: Strategies to protect your investments.
Whether you're a beginner or an experienced trader, this guide breaks down essential tools and strategies to help you navigate the volatile crypto market with confidence.
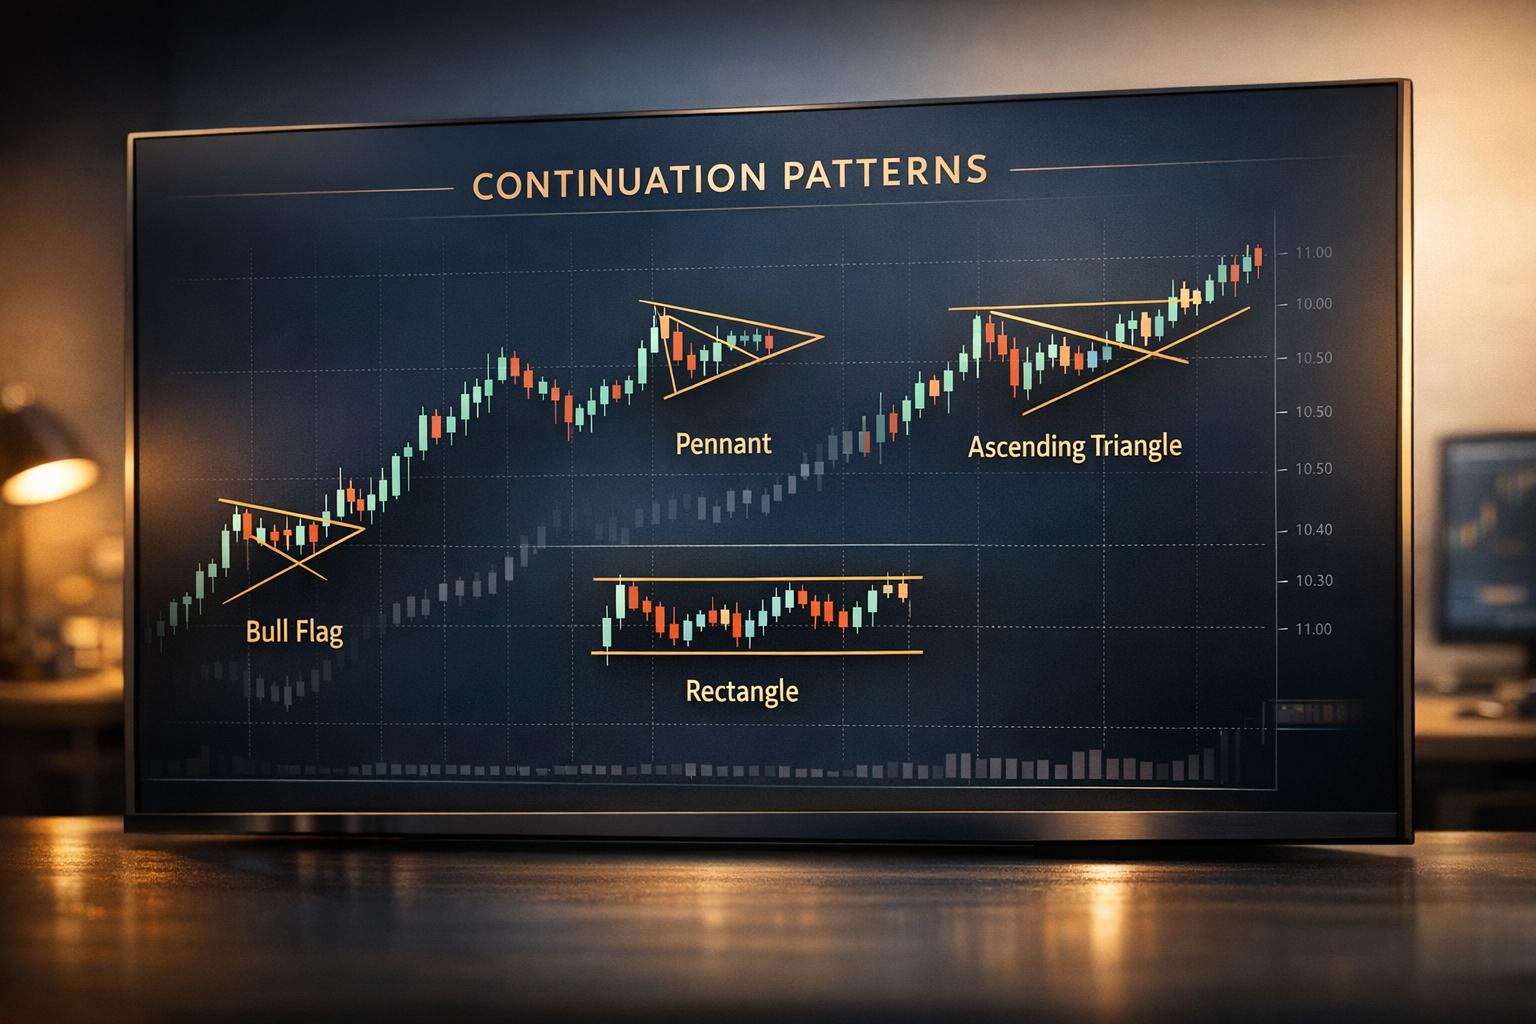
Chart Types and Patterns
How to Read Candlestick Charts
Understanding candlestick charts is a must for making informed trading decisions. These charts are a favorite among crypto investors for a good reason - they provide a clear snapshot of market movements[3]. Each candlestick represents four key price points: open, high, low, and close[2][4][5]. The body of the candle shows the range between the opening and closing prices, while the wicks (or shadows) highlight the highest and lowest prices during that period[2][4][5]. Once you’ve got the hang of candlesticks, you can dive into other chart patterns to broaden your technical analysis skills.
Easy Crypto Technical Analysis Tutorial for Beginners (Step-by-Step)
Technical Indicators for Crypto Trading
Technical indicators are a powerful way to turn raw price, volume, and volatility data into actionable trading insights. By providing quantitative confirmation of price patterns, these tools help traders make sense of the often chaotic movements in crypto markets[6][9].
Indicators are typically divided into two groups: overlays, which appear directly on price charts (like Bollinger Bands), and oscillators, which are displayed in separate panels (such as RSI and MACD)[6]. Additionally, they can be classified as either leading indicators, which attempt to predict future price movements, or lagging indicators, which confirm trends after they’ve started[6]. This classification helps traders understand how to use these tools effectively.
Research highlights the value of technical indicators in crypto trading. For instance, a study of 124 indicators found they had "predictive power for narrow ranges of bitcoin daily returns", demonstrating the utility of technical analysis in markets like Bitcoin[6]. In another example, machine learning models using RSI and MACD data achieved over 86% accuracy in generating Bitcoin trading signals[6].
Moving Averages (SMA and EMA)
Moving averages are fundamental tools for identifying trends by smoothing out price fluctuations. The Simple Moving Average (SMA) calculates the average price over a set period, while the Exponential Moving Average (EMA) gives more weight to recent prices, making it more responsive to current market conditions.
In crypto trading, moving averages often act as dynamic support and resistance levels. For example, when Bitcoin's price stays above its 50-day moving average, it may indicate an uptrend, while falling below this level could suggest bearish momentum. Popular strategies include using the 9/21 EMA crossover for short-term signals and the 50/200 SMA "golden cross" for spotting longer-term trends. A shorter moving average crossing above a longer one often signals a buying opportunity, whereas the reverse might suggest it’s time to sell.
Relative Strength Index (RSI)
The RSI is a momentum oscillator that measures the speed and change of price movements, producing a value between 0 and 100. It’s especially useful for spotting overbought conditions (above 70) or oversold conditions (below 30)[7]. In volatile markets, traders may tweak these thresholds to reduce false signals, such as using 80/20 instead of 70/30.
Some traders prefer shorter periods, like 7–9, for quicker signals, while others use longer periods, such as 21, for smoother readings[8]. RSI is particularly effective in range-bound markets, where prices bounce between support and resistance levels. For instance, when Bitcoin’s RSI dips below 30 and starts climbing, it might signal a potential rebound. Similarly, an RSI above 70 that begins to decline could hint at an upcoming pullback.
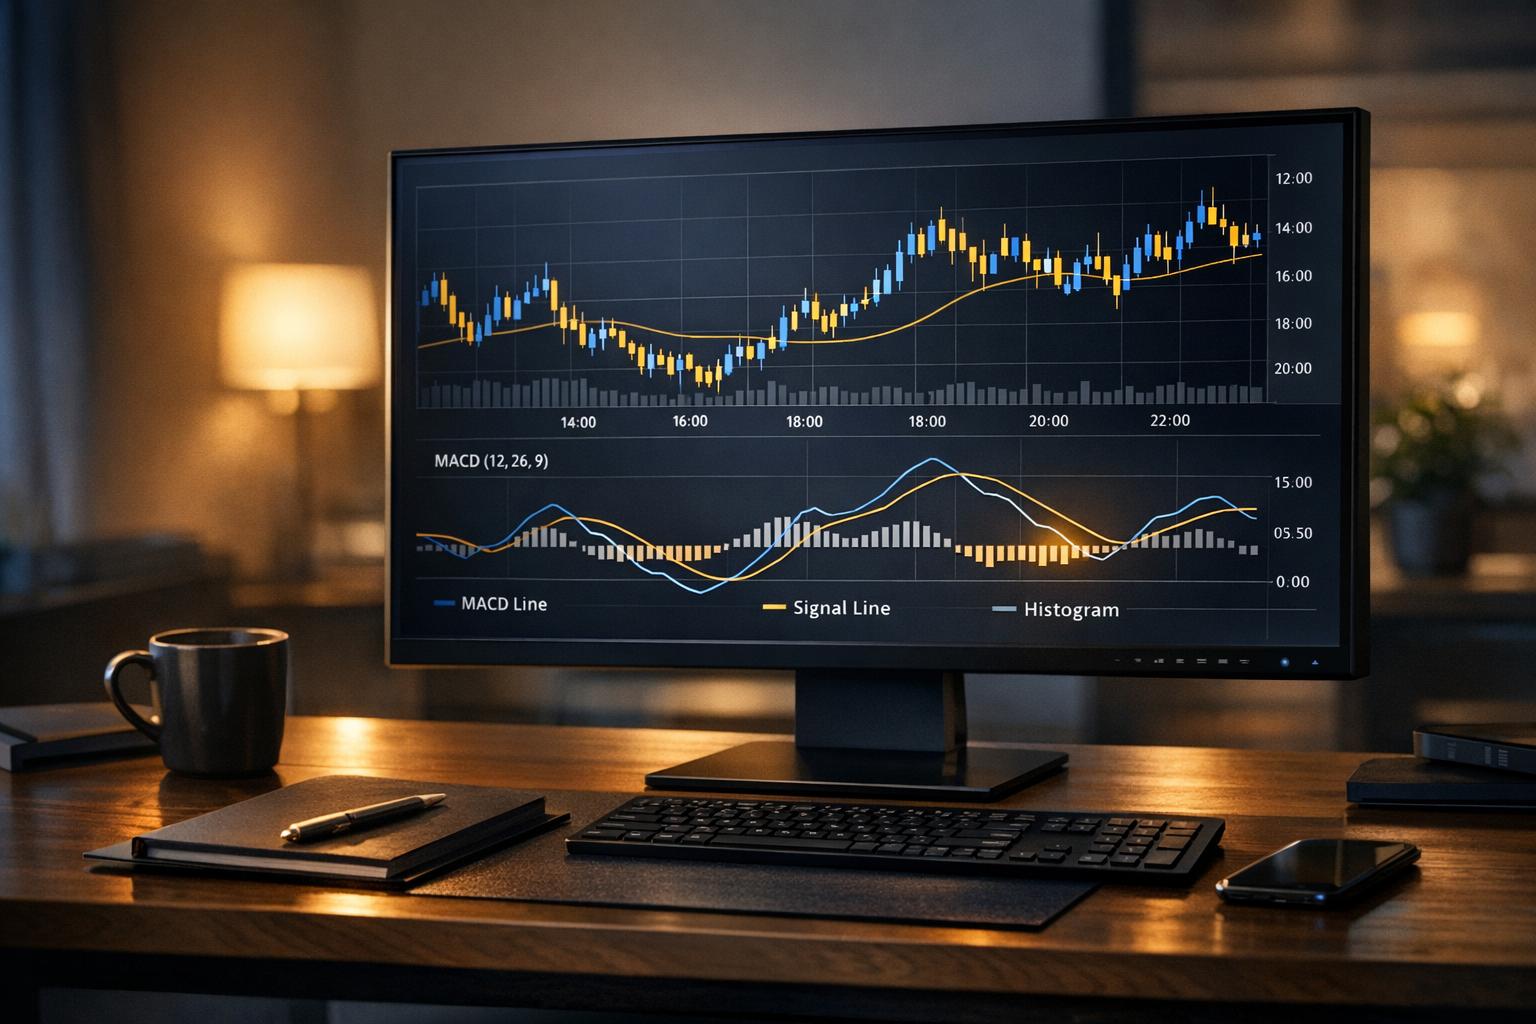
MACD for Momentum Analysis
The Moving Average Convergence Divergence (MACD) is a momentum indicator that analyzes the relationship between two moving averages. It includes the MACD line, signal line, and histogram, each providing insights into market trends and momentum.
A bullish signal occurs when the MACD line crosses above the signal line, while a bearish signal happens when it crosses below. The histogram indicates the strength of these signals, with larger bars reflecting stronger momentum. Research shows MACD’s effectiveness in crypto markets, with one study finding "strong support" for variable moving average strategies on Bitcoin[6].
MACD becomes even more powerful when paired with other indicators. For example, combining a MACD bullish crossover with an RSI emerging from oversold conditions can provide a more reliable buy signal. In volatile crypto markets, it’s wise to use MACD alongside tools like volume indicators or Bollinger Bands for added confirmation[7]. Aligning MACD signals with the overall market trend is key to making informed decisions.
AI-Powered Tools for Technical Analysis
Traditional methods of technical analysis can be time-consuming and require meticulous effort. However, AI-powered tools are changing the game by automating complex processes and delivering real-time insights. This shift is particularly beneficial in the fast-paced, 24/7 world of cryptocurrency trading, where quick, accurate decisions are essential.
By building on traditional technical indicators, these tools now handle data analysis and pattern recognition automatically, saving traders countless hours and reducing the potential for human error.
StockioAI Overview
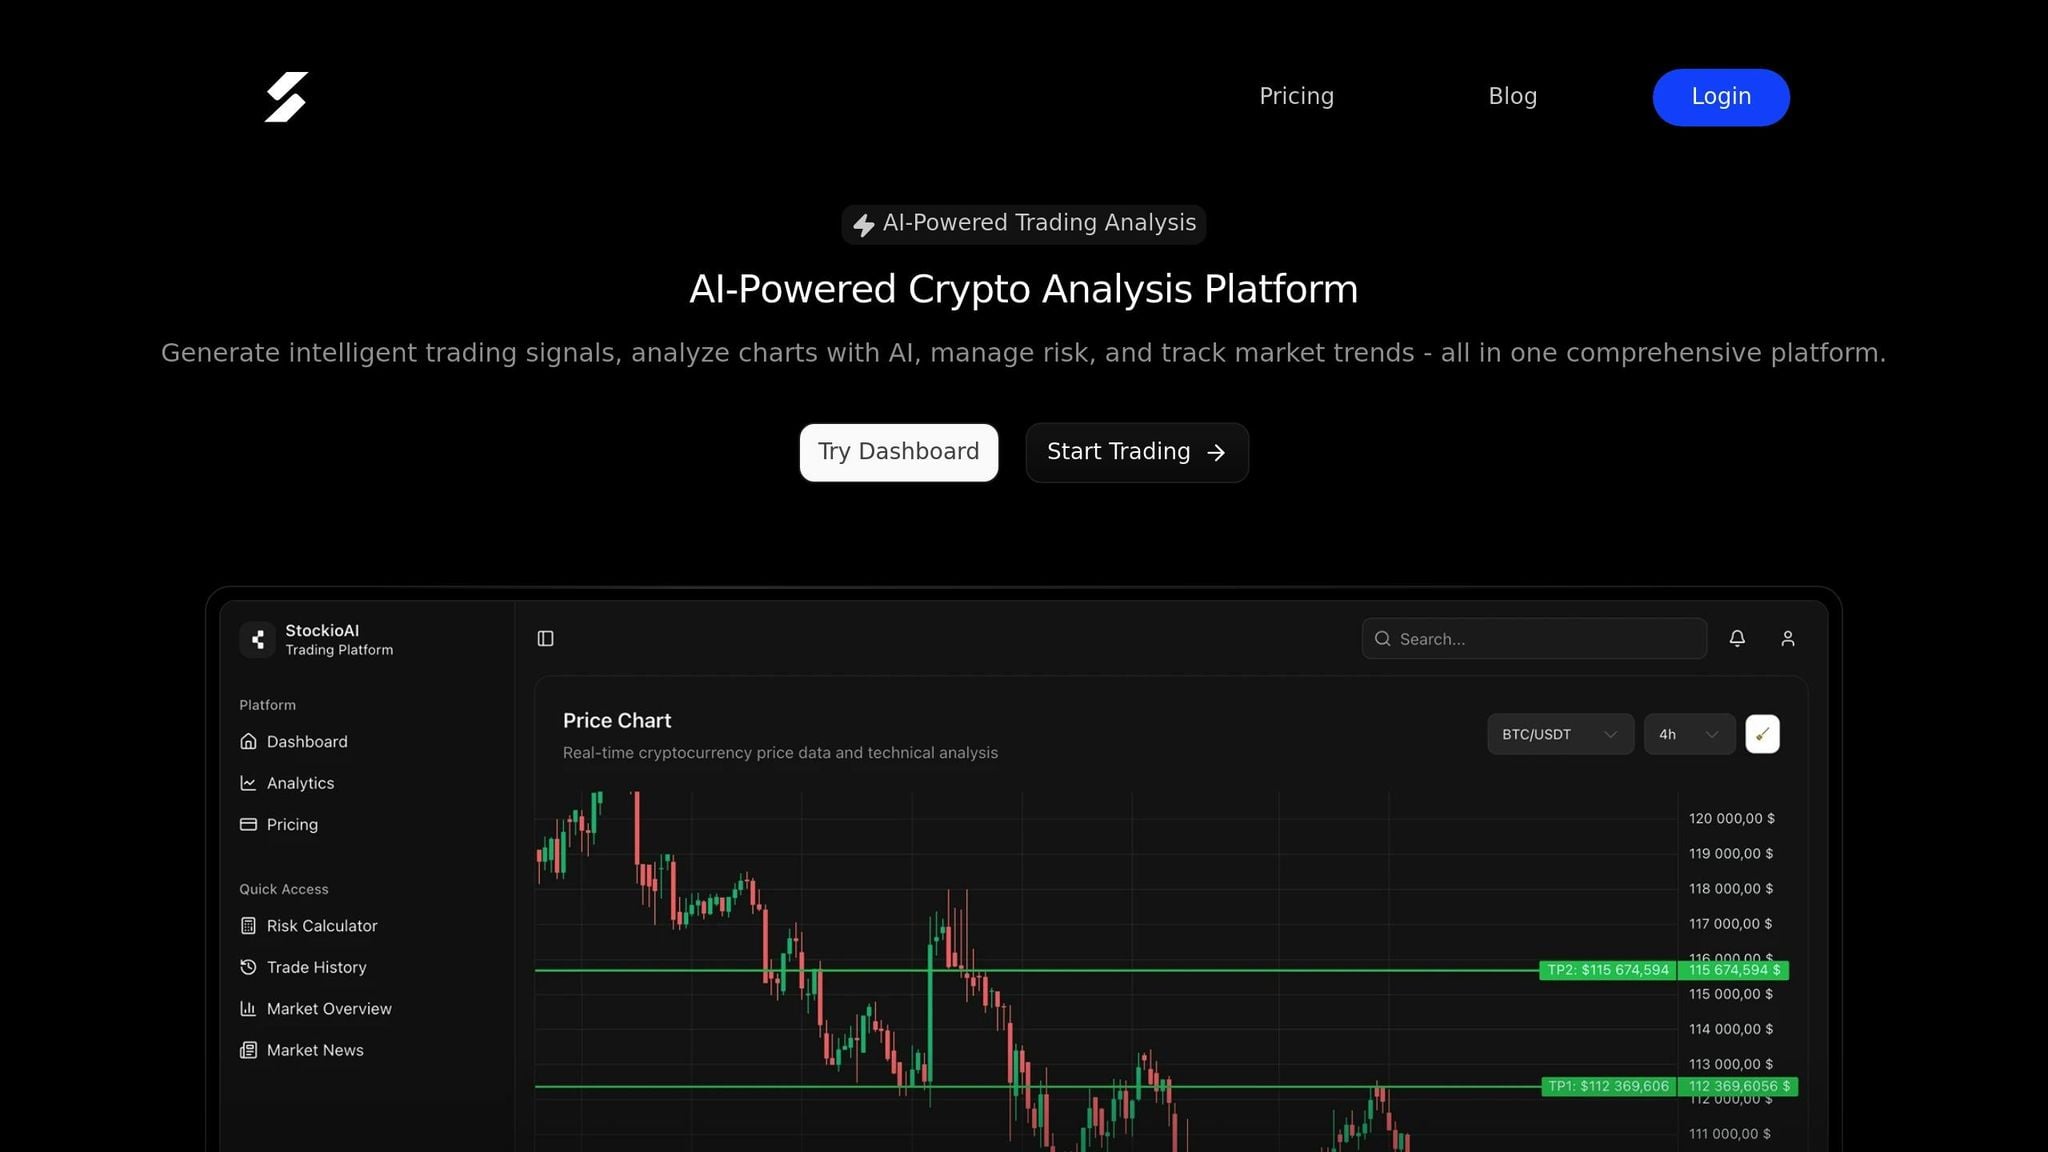
StockioAI leverages machine learning to simplify technical analysis for cryptocurrency traders. The platform processes over 60 real-time data points per second, converting raw market information into actionable signals and insights [10]. Its AI Pattern Recognition system identifies chart patterns, trend reversals, and optimal entry and exit points, eliminating the guesswork from trading decisions.
The system generates three types of trading signals - BUY, SELL, and HOLD:
-
BUY Signals: These are based on key indicators and come with detailed entry points, stop-loss levels, profit targets, and confidence scores.
-
SELL Signals: These are calculated using resistance levels, momentum factors, and market trends to determine the best exit points.
-
HOLD Recommendations: These evaluate current positions by analyzing sideways trends, correlation patterns, and market microstructure.
StockioAI also offers Interactive Chart Analysis, featuring AI-generated trading levels, support/resistance zones, and advanced technical indicators. Additionally, it provides a real-time market overview, highlighting trending coins and the latest news updates.
How AI Improves Trading Decisions
AI tools bring a new level of precision and objectivity to trading. By removing emotional bias, they allow traders to make decisions based purely on data. These tools also enable multi-timeframe analysis, scanning multiple chart intervals at once to identify confluence zones - areas where different timeframes align to create high-probability trading opportunities.
Moreover, AI systems excel at quickly spotting emerging patterns across a wide range of cryptocurrencies, helping traders seize opportunities with better timing.
For example, one user shared their experience:
"StockioAI revolutionized my trading strategy. The AI insights helped me achieve consistent 18% monthly returns."
- Jordan Martinez, Quantitative Trader [10]
StockioAI Pricing Plans Comparison
StockioAI offers pricing options tailored to traders of all levels, from beginners to institutions. Here’s a breakdown of their plans:
| Plan | Monthly Price | AI Signals | Key Features | Best For |
|---|---|---|---|---|
| Free | $0 | 2 signals | Basic market insights, community support, mobile app access, educational resources | Beginners exploring AI analysis |
| Starter | $49 | 30 signals | Basic technical analysis, email support, standard indicators | Individual traders starting with AI |
| Professional | $99 | 300 signals | Advanced pattern recognition, priority support, portfolio tracking, API access | Active traders needing comprehensive tools |
| Enterprise | $199 | Unlimited | Multi-user access, dedicated account manager, custom AI training, white-label solutions | Institutions and professional trading teams |
These pricing tiers ensure that both novice and experienced traders can access AI capabilities suited to their needs, enhancing their trading strategies while scaling with their expertise.
Risk Management and Trading Best Practices
Navigating the unpredictable world of crypto trading means safeguarding your investments while riding out the market's ups and downs.
Key Risk Management Principles
To protect your capital, start with the basics: set clear exit plans and use stop-loss orders to cap potential losses. Make sure your position sizes align with your personal risk tolerance - don’t overextend yourself. Keeping a trading journal is another smart move; it lets you track your decisions and fine-tune your approach over time. These tried-and-true methods lay the groundwork for incorporating advanced tools into your risk management strategy.
How AI Can Help Manage Risk
AI tools bring an extra layer of precision to risk management. By constantly monitoring market data, they can adjust position sizes, optimize stop-loss levels, and send automated alerts when your portfolio approaches critical risk levels. However, while AI can fine-tune your strategy, it’s most effective when paired with the fundamentals. Combining these AI-driven insights with traditional trading practices and technical analysis can give you a stronger edge in the ever-volatile crypto market.
Step-by-Step Technical Analysis Process
A structured approach can turn guesswork into well-informed decisions. Following a clear, step-by-step process helps you evaluate crypto opportunities with consistency and clarity.
Step 1: Select Chart Type and Timeframe
Start by choosing a candlestick chart - it’s great for visualizing price action and understanding market sentiment.
Next, pick a timeframe that aligns with your trading style. For day traders, shorter intervals like 5-minute or 1-hour charts work best. If you’re into swing or position trading, longer intervals like 4-hour or daily charts may suit you better.
Your choice of timeframe should also match your availability and risk tolerance. For instance, if you can only check charts a few times a day, shorter timeframes might lead to missed opportunities. On the other hand, using daily charts for trades that demand quick decisions could mean overlooking crucial price changes.
Once your chart and timeframe are set, you’re ready to identify trends and key price levels.
Step 2: Find Trends and Key Price Levels
With your chart ready, the next step is spotting the overall trend. Draw trend lines by connecting at least two significant highs for a downward trend or two significant lows for an upward trend. The more the price touches these lines, the stronger the support or resistance they represent.
In crypto markets, support and resistance zones often hold more weight than pinpoint price levels. For example, Bitcoin tends to find support within a range rather than at a specific price. Mark these zones on your chart using horizontal lines or rectangles.
You can also use Fibonacci retracement levels to identify potential reversal points during pullbacks. After a major price move, apply Fibonacci retracement from the swing low to the swing high. Levels like 38.2%, 50%, and 61.8% often act as temporary support or resistance, offering valuable clues for entry or exit points.
Don’t forget to analyze volume - this adds an extra layer of insight. If prices rise alongside increasing volume, it signals strong buying interest. Conversely, price increases on declining volume might indicate weakening momentum. Keep an eye on volume spikes near key support and resistance zones, as they often signal potential trend reversals.
Step 3: Confirm Signals with Indicators and AI
After identifying trends and key price levels, it’s time to validate your findings. Technical indicators are your go-to tools here, but avoid cluttering your chart. Start simple - use moving averages to assess trend strength. For example, if the price stays above the 50-day moving average, it suggests bullish momentum. The interaction between short-term (e.g., 20-day) and long-term (e.g., 50-day) moving averages can also confirm trends. A bullish crossover, where the short-term average moves above the long-term average, often precedes upward price movements.
To refine your analysis further, incorporate indicators like RSI and MACD. RSI helps identify overbought (above 70) or oversold (below 30) conditions, though in strong trends, these levels can persist longer than expected. MACD crossovers or divergences, on the other hand, are useful for spotting momentum shifts.
For an added layer of precision, leverage StockioAI. This platform analyzes multiple data points, compares patterns across different timeframes, and identifies correlations between indicators. It even provides probability assessments for potential price moves. Combining AI-driven insights with traditional techniques helps filter out false signals and boosts your confidence in making decisions.
Conclusion: Your Path to Technical Analysis Success
Becoming skilled in technical analysis for crypto trading isn’t about memorizing every tool or indicator. It’s about developing a structured, data-driven approach that helps you make informed decisions. With practice, patience, and the right resources, you can transition from a beginner to a confident trader.
Key Points to Keep in Mind
Technical analysis is your guide to navigating the fast-paced world of crypto trading. By sticking to rule-based systems, you can minimize emotional decisions and focus on clear signals from tools like candlestick patterns, trend lines, and indicators [11]. This approach reduces the likelihood of impulsive trades.
The real advantage comes when you combine multiple indicators. For example, pairing RSI (to spot overbought conditions) with MACD (to confirm momentum shifts) can lead to stronger, more reliable trade signals [11][1]. This layered strategy helps filter out misleading signals that often trip up new traders.
Risk management is just as important as technical analysis. Using stop losses, following the 2% rule, and maintaining a solid reward-to-risk ratio can protect your capital and keep you in the game [11][1]. Even the most accurate analysis won’t matter if you’re not managing your risk effectively.
To take your trading to the next level, consider using tools like StockioAI. Its AI-powered insights can help confirm signals and speed up your decision-making process. Combine these insights with your manual analysis for a more comprehensive approach.
Taking Action: What to Do Next
Start by mastering the basics - learn how to read candlestick charts, understand moving averages, and identify trends [11][1]. If you’re new to AI tools, open a StockioAI account and explore its Free plan to see how AI trading signals can complement your analysis. The platform also offers educational resources and a supportive community to guide you as you learn.
Begin trading with small positions to build your confidence. Keep a detailed trade journal to track your performance. Note which indicators worked well, where you might have missed a pattern, and how your risk management held up [11]. This habit will help you refine your strategy over time.
Experiment with strategies like moving average crossovers, pullback trades in trending markets, or breakouts at resistance levels [11]. Use StockioAI’s screeners and filters to find setups that fit your criteria, then apply your technical skills to validate them.
Finally, remember that trading success comes from continuous learning and adapting. Markets evolve, and new patterns will emerge. By combining traditional technical analysis with AI-powered insights, you’ll be better equipped to navigate crypto’s ever-changing landscape and find opportunities to thrive.
FAQs
How can AI tools like StockioAI improve my crypto trading and technical analysis?
AI tools, such as StockioAI, bring a new level of efficiency to crypto trading and technical analysis. They handle complex data processing, identify market trends, and execute trades with impressive speed and accuracy - qualities that are crucial in the ever-changing and fast-paced world of cryptocurrency.
By eliminating emotional decision-making and delivering real-time insights, these tools empower traders to make smarter choices. They also improve risk management practices, helping to achieve consistent and efficient trading results that align with individual goals.
What are the advantages of using RSI and MACD together in crypto trading?
Combining the Relative Strength Index (RSI) and Moving Average Convergence Divergence (MACD) in crypto trading gives you a more complete picture of market activity. RSI highlights overbought and oversold conditions, which can signal potential price reversals. Meanwhile, MACD tracks the strength and direction of trends by analyzing the relationship between moving averages.
When used together, these tools can boost your confidence in making trading decisions. For instance, if RSI shows an oversold condition and MACD indicates bullish momentum, it could point to a strong buying opportunity. This pairing helps filter out false signals, making it easier to pinpoint entry and exit points in the unpredictable crypto market.
What are the best ways to manage risk in crypto trading using technical analysis?
Managing risk in crypto trading begins with using technical analysis tools to guide your decisions. Strategies like setting stop-loss orders can help cap potential losses, while identifying support and resistance levels allows you to better time your trades. Spotting trend signals and reversal patterns is another way to shield yourself from sudden market shifts.
It’s also wise to practice position sizing, meaning you allocate only a small portion of your portfolio to each trade. Regularly rebalancing your investments can further keep risk in check. The key to navigating the unpredictable crypto market is having a solid risk management plan and sticking to it with discipline.