AI tools have transformed how traders identify stock chart patterns like Head and Shoulders, triangles, and candlestick formations. These platforms analyze thousands of assets in real time, providing faster, data-driven insights compared to manual methods. Here’s a quick look at five leading AI-driven tools:
- StockioAI: Specializes in U.S. stocks and cryptocurrencies with 80–90% accuracy. Pricing starts at $29.99/month.
- TrendSpider: Offers multi-timeframe analysis and advanced scanning features. Plans begin at $49.68/month (billed annually).
- Tickeron: Features tools for intraday and end-of-day analysis with confidence scoring. Pricing starts at $20/month.
- TradingView: Supports automated and community-driven pattern detection with extensive asset coverage. Advanced features require a Premium subscription.
- Trade Ideas: Focuses on U.S. equities with AI-driven stock picks and backtesting. Plans start at $127/month.
Each tool caters to different trading needs, from casual users to advanced traders. Below is a comparison to help you decide.
Quick Comparison
| Tool | Key Features | Asset Coverage | Starting Price |
|---|---|---|---|
| StockioAI | Real-time signals, 80–90% accuracy | U.S. stocks, cryptocurrencies | $29.99/month |
| TrendSpider | Multi-timeframe analysis, AI scanning | Stocks, forex, crypto | $49.68/month (ann.) |
| Tickeron | Confidence scoring, intraday tools | Global stocks, ETFs, crypto | $20/month |
| TradingView | Community-driven, automated detection | Stocks, crypto, forex, futures | Premium required |
| Trade Ideas | Holly AI, backtesting tools | U.S. equities | $127/month |
These tools streamline trading decisions by identifying patterns faster and with greater precision, making them useful for traders at all levels.

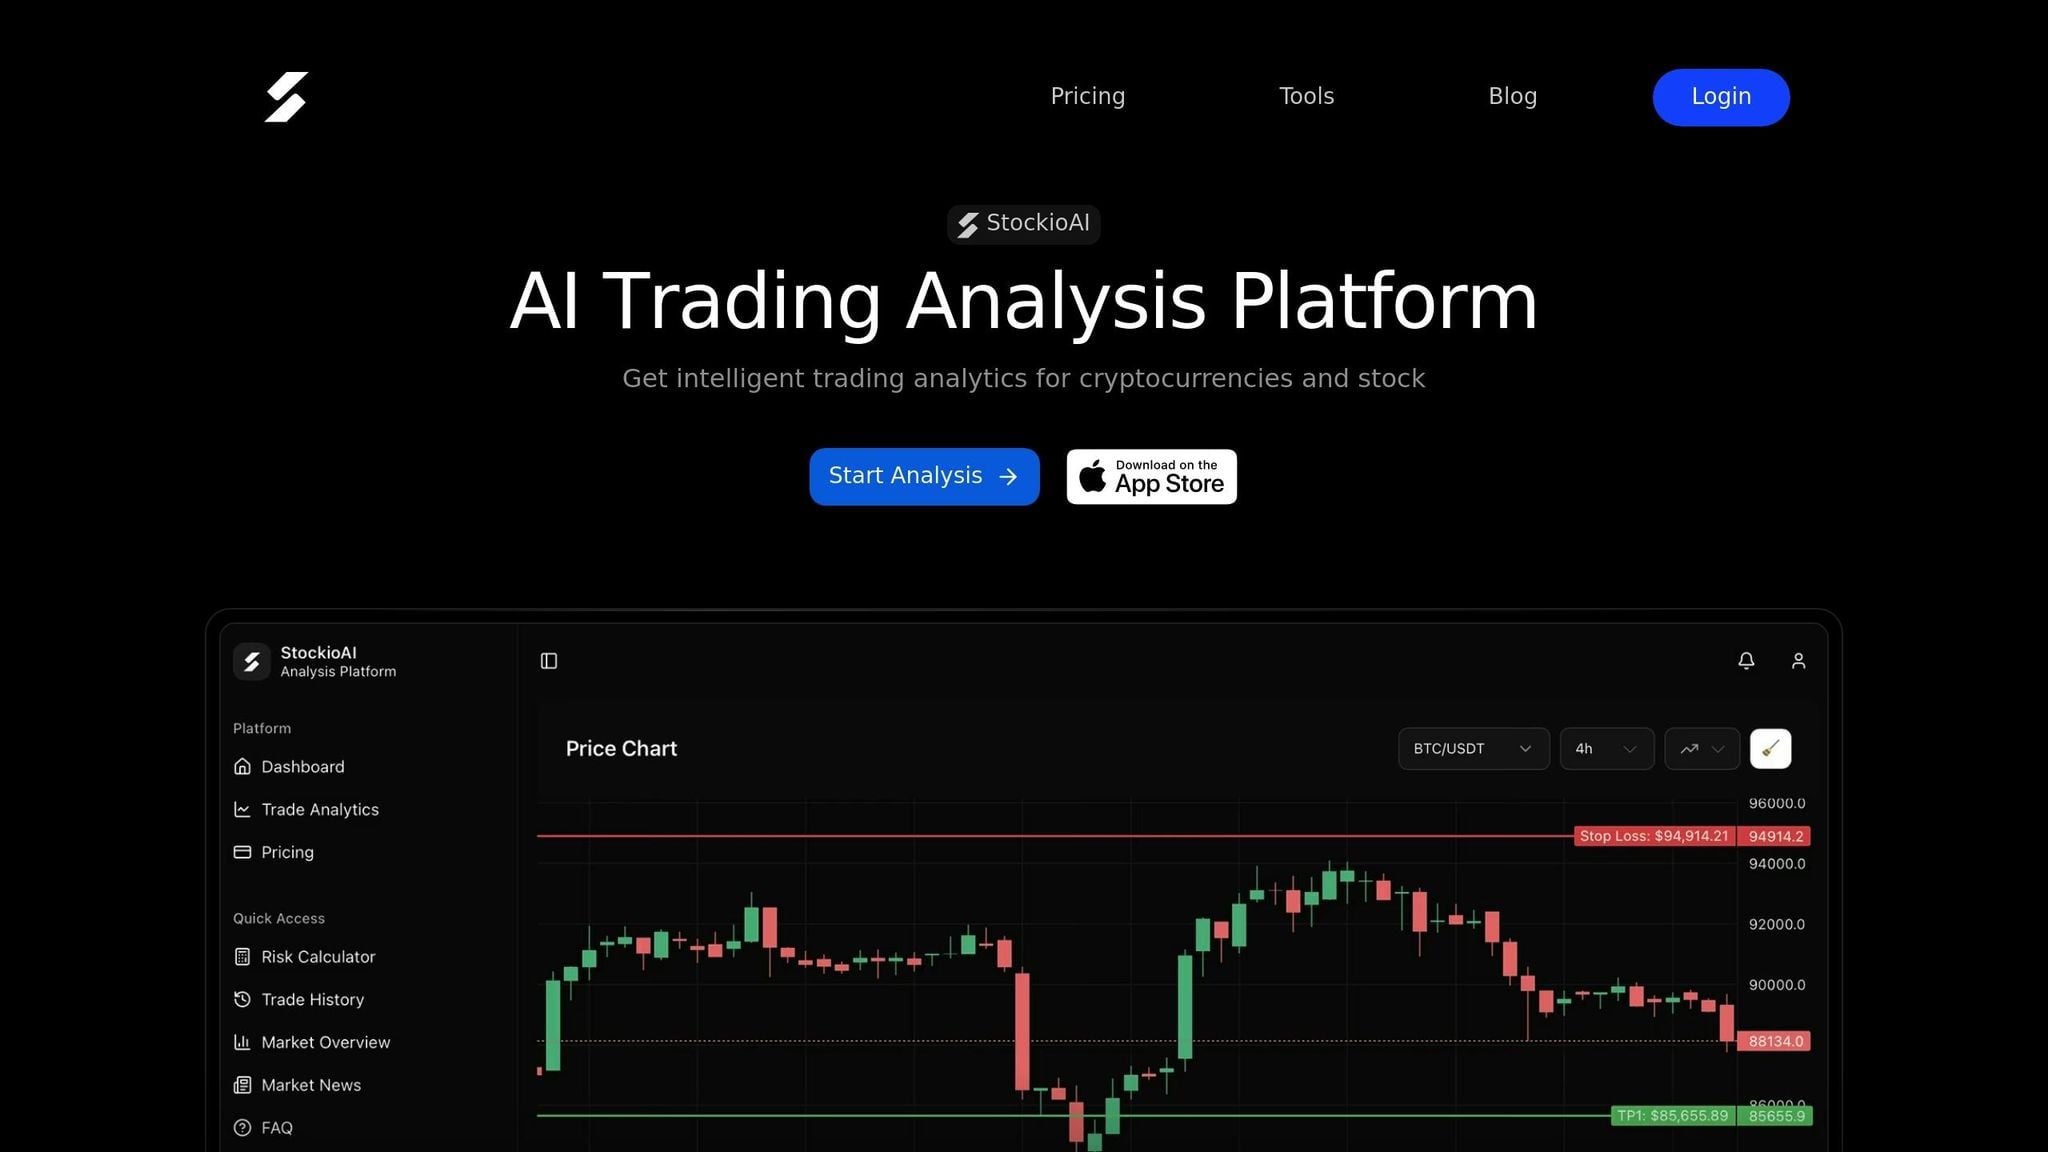
1. StockioAI
Pattern Detection Capabilities
StockioAI specializes in identifying three main types of chart patterns: reversal patterns (like Head and Shoulders, Double Top/Bottom, and Inverse Head and Shoulders), continuation patterns (such as Flags, Pennants, and Triangles), and support/resistance patterns (including Wedges, Channels, and Rectangles).
Using advanced machine learning, deep learning, and computer vision, StockioAI fine-tunes its criteria to spot intricate price relationships and analyze candlestick charts visually. The platform processes over 60 data points per second - tracking volume spikes, sentiment changes, and institutional trades - to deliver fast and precise insights. Let’s dive into how reliable these signals are.
Accuracy of Signals
StockioAI claims an impressive 80-90% accuracy in capital protection signals [3]. Each signal is accompanied by detailed guidance, including suggested entry points, stop-loss levels, profit targets, and confidence scores. To further assist traders, it offers a risk calculator that helps determine the right position size based on account balance and risk tolerance. These high-accuracy signals ensure traders can make informed decisions across a broad range of assets.
Asset Coverage
The platform provides coverage for major U.S. stocks, including popular names like AAPL, META, GOOGL, TSLA, NVDA, and AMZN, with automated daily analysis. For those focused on cryptocurrencies, StockioAI tracks assets like BTC, ETH, SOL, and XRP, offering automatic updates every four hours. This dual focus on traditional stocks and digital currencies provides traders with the flexibility to navigate both markets with ease.
Pricing and Plans
StockioAI offers two pricing options:
- Free Plan: Includes 5 AI-generated trading signals and basic insights.
- Premium Plan: Priced at $29.99 per month (or $9.99 per week), this plan unlocks unlimited trading signals, advanced pattern recognition, portfolio tracking, real-time alerts, and priority customer support. It also includes 4-hourly cryptocurrency analyses and daily updates for six major tech stocks.
Whether you're a casual trader or a more active investor, StockioAI’s pricing plans cater to a range of needs.
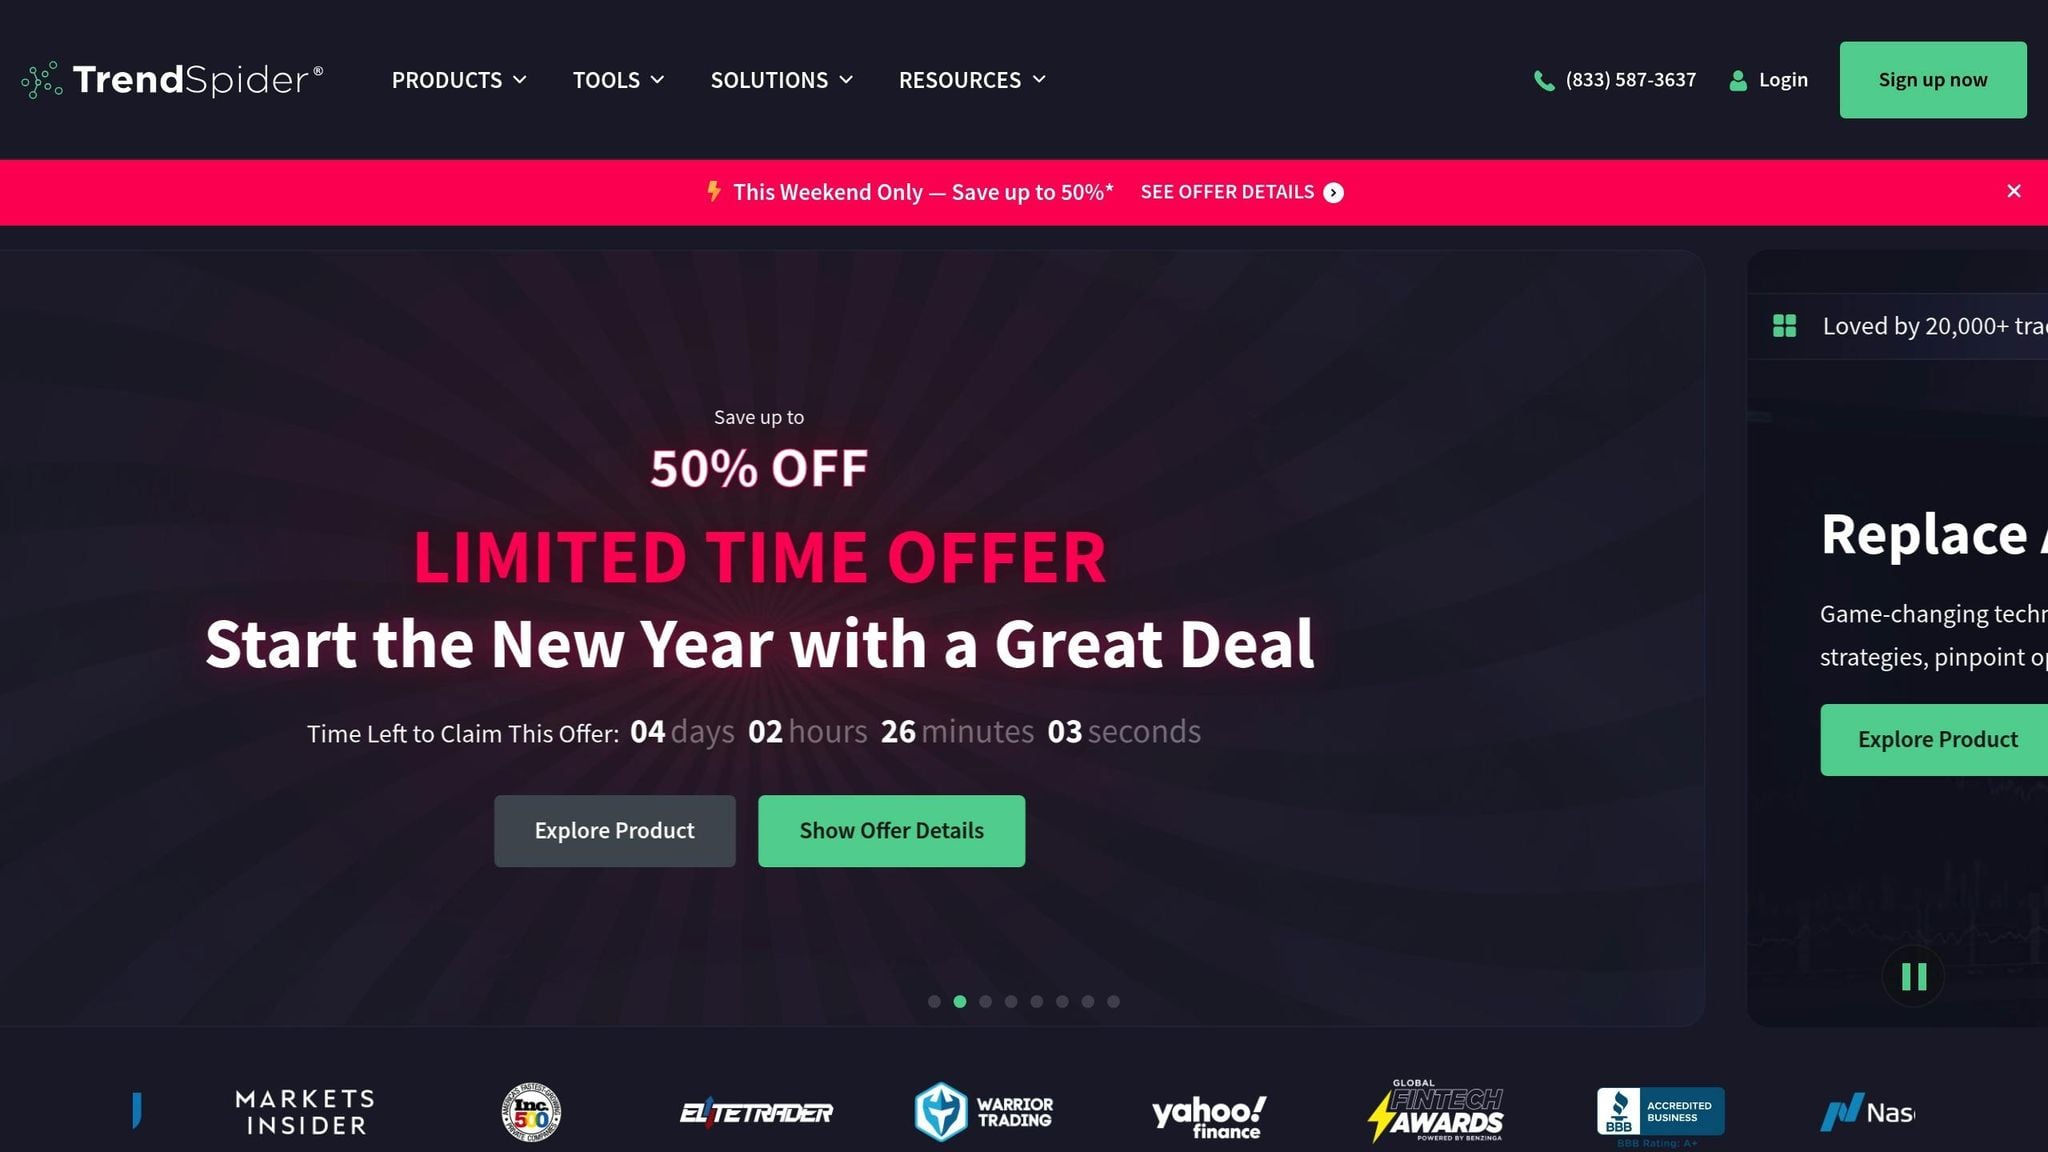
2. TrendSpider
Pattern Detection Capabilities
TrendSpider is designed to spot a wide variety of actionable chart patterns, including triangles, double tops and bottoms, channels, Head and Shoulders (both regular and inverse), as well as Rising and Falling Wedges [5][6]. It’s built to filter out patterns that are outdated, premature, or invalid, so you’re only presented with actionable opportunities [5].
One standout feature is the Sidekick AI Analyst, a virtual assistant that simplifies chart analysis. It can review charts, highlight key levels, interpret price movements, and even create market scanners based on natural language commands [4][9]. For instance, you can ask it to "Find all Russell 2K stocks with a Descending Triangle on a Daily chart", and it will immediately scan for matches [5][9]. Beyond pattern detection, the platform identifies trendlines, Fibonacci levels, support and resistance zones, and over 300 candlestick patterns [8]. This comprehensive detection system ensures traders have access to reliable, data-backed signals.
Accuracy of Signals
TrendSpider uses AI-powered analysis to identify chart patterns with mathematical accuracy [4]. Its Strategy Tester allows traders to check the reliability of these patterns by analyzing up to 50 years of historical data. This feature provides detailed performance metrics like win rates, profitability, and drawdowns [5][11]. Barry D. Moore, a Certified Financial Technician, noted that TrendSpider's automated trendline detection often surpasses manual efforts in accuracy [11].
The platform recognizes over 150 candlestick patterns and more than 18 distinct chart patterns [10][11]. To maintain signal integrity, it automatically discards patterns that are no longer valid or have already played out in the market [5]. With an average rating of 4.6/5 from over 20,000 users, many traders praise the platform for eliminating the need for manual chart analysis [4][7].
Asset Coverage
TrendSpider offers real-time data for over 300,000 assets across multiple markets [7]. This includes U.S. equities, ETFs, ETNs, global forex, cryptocurrencies, and futures from major exchanges like CME, NYMEX, COMEX, and CBOT [7]. The platform also tracks major indexes such as those from CBOE and NASDAQ, and provides access to 50 years of historical price data for backtesting [4][8]. Additionally, it delivers advanced data insights like Dark Pool volume, Unusual Options Flow, Corporate Insider trading, and even U.S. Congressional trading activity [8].
Pricing and Plans
TrendSpider offers several pricing tiers to suit different trading needs:
- Standard Plan: Approximately $49.68/month (billed annually). Includes 1-minute charting, 10 alerts, and 5 trading bots [7].
- Premium Plan: Around $54.60/month (billed annually). Adds 5-minute scanning/backtesting, 50 alerts, and 10 trading bots [7].
- Enhanced Plan: Priced at about $67.10/month (billed annually). Features 1-minute scanning, 100 alerts, and 50 trading bots [7].
- Advanced Plan: Costs roughly $107/month (billed annually). Includes 1-minute scanning, 400 alerts, and 100 trading bots [7].
The Sidekick AI add-on is available in tiers, starting with a free option that includes 25 messages per month and going up to a Max tier at $349/month for 1,000 messages [7].
Using AI To Detect Chart Patterns
3. Tickeron
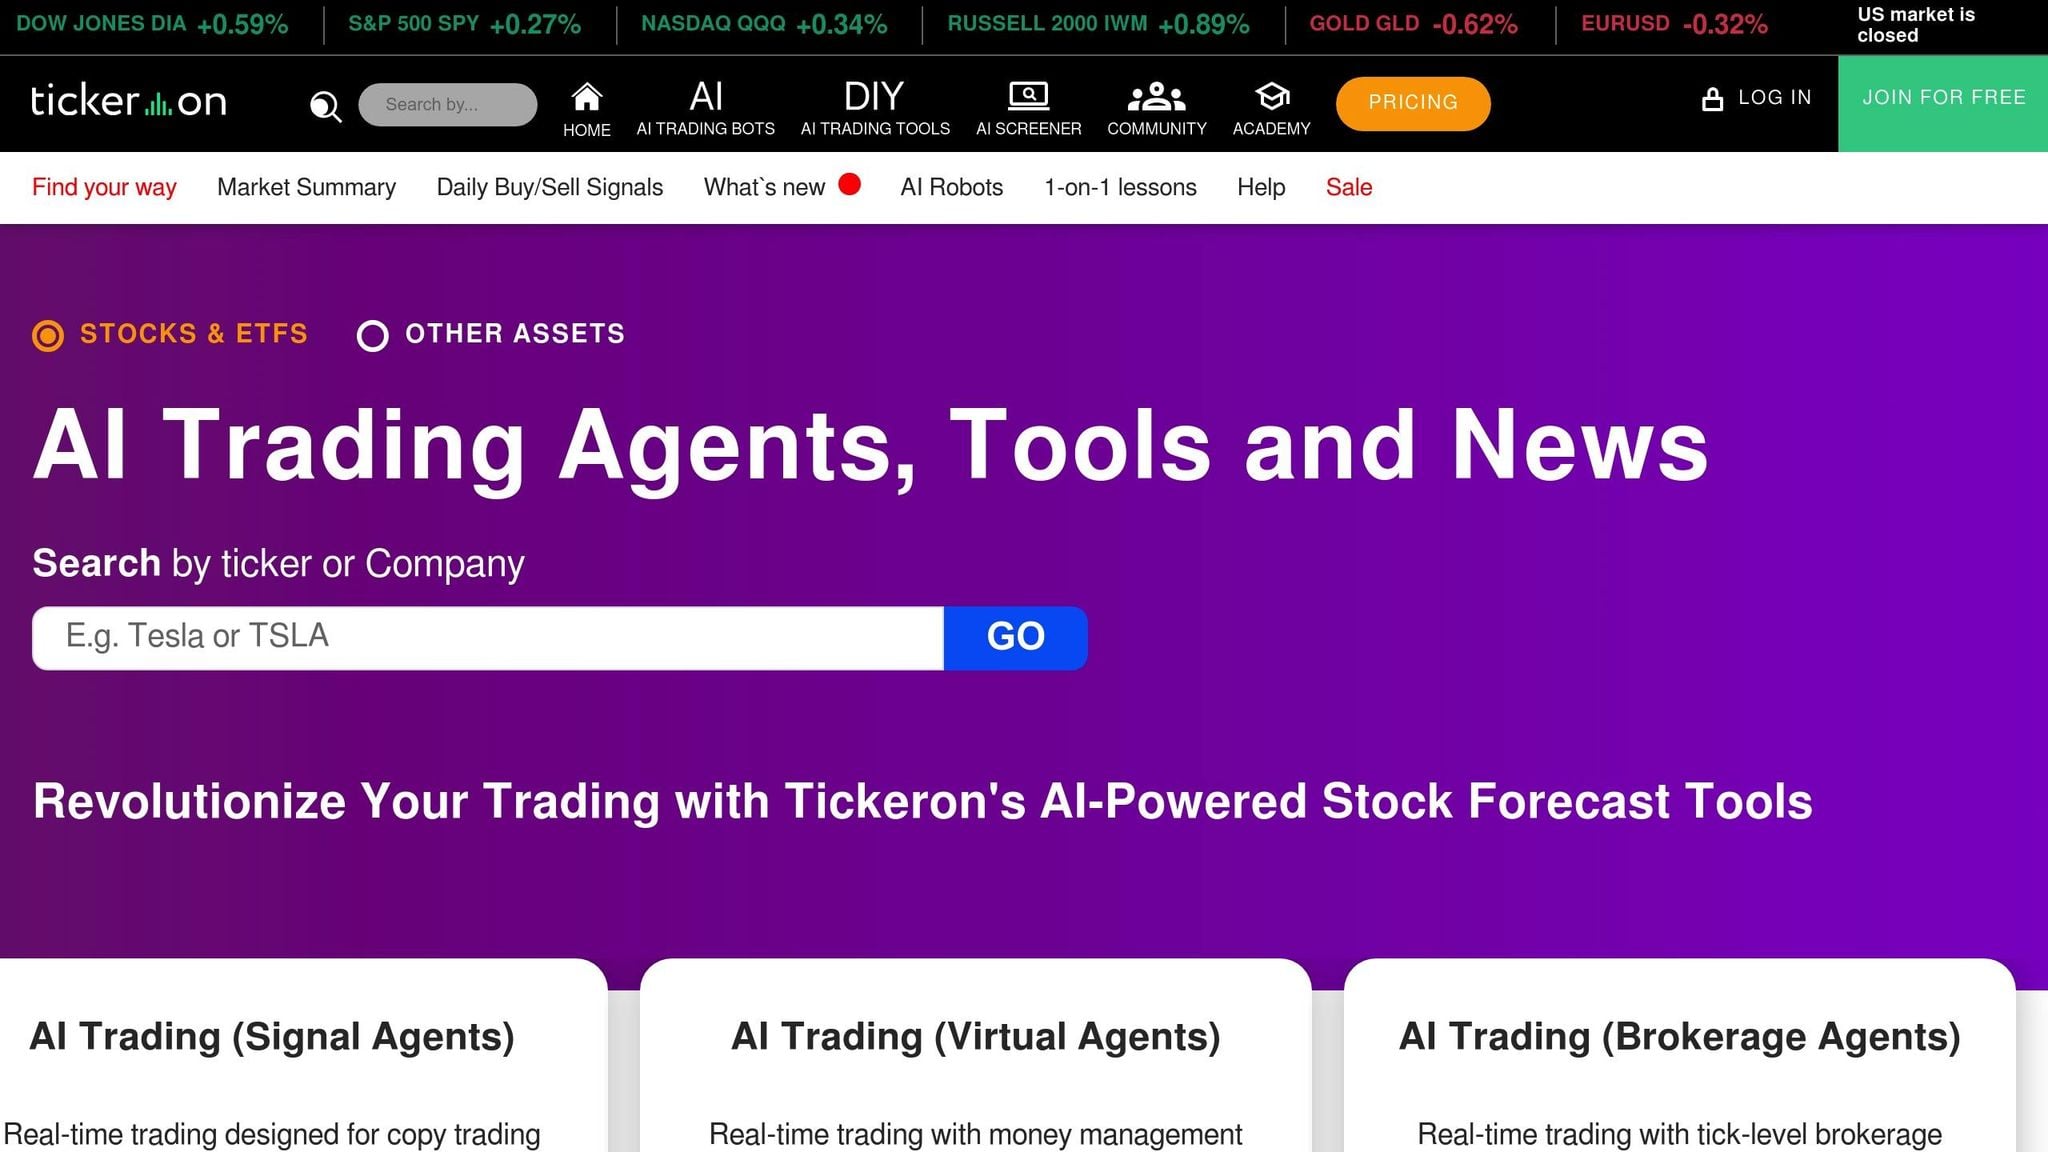
Tickeron takes a data-driven approach to trading, offering tools that complement platforms like StockioAI and TrendSpider.
Pattern Detection Capabilities
Tickeron uses its proprietary Financial Learning Models (FLMs) and machine learning to analyze thousands of assets for technical chart patterns [12]. The platform features two standout tools: the Pattern Search Engine (PSE) for end-of-day analysis and Real-Time Patterns (RTP) for intraday trading [13]. It can recognize between 19 and 39 trading patterns, including well-known ones like the Cup-and-Handle and Head-and-Shoulders [12]. What makes Tickeron especially useful is its ability to predict breakout prices, target prices, and confidence levels for each pattern, all based on historical backtesting [12]. The AI scans markets in real time and across various timeframes, ranging from 5 minutes to 1 day [12].
"RTP is a game-changer for traders. By combining AI with our proprietary Financial Learning Models (FLMs), we empower traders to navigate volatile markets with clarity and confidence." – Sergey Savastiouk, Ph.D., CEO, Tickeron [12]
Accuracy of Signals
Tickeron assigns a confidence level to each trading signal, indicating the likelihood of hitting the predicted target [2]. These confidence levels are backed by automated backtesting, which evaluates win/loss ratios and annualized returns for specific patterns [14]. Traders can customize their filters to focus on patterns with a minimum confidence level, typically 50% or higher [14]. Historical data supports these claims: Ascending Triangles have a 68% accuracy rate, Bullish Cup-and-Handle patterns 65%, and Bearish Head-and-Shoulders Tops 58% [14]. For example, in September 2025, RTP identified a Bearish Pennant on Phio Pharmaceuticals Corp. (PHIO) at $2.18, predicting a 7.80% profit target with 37% confidence. That same month, it spotted a Bullish Rectangle Top on IBO at $0.71, forecasting a 2.3% gain with 73% confidence [14]. Overall, Tickeron’s AI-detected patterns have delivered returns averaging 12% higher than manual charting across over 10,000 historical trades [14].
Asset Coverage
Tickeron scans thousands of global symbols across major asset classes [12]. Its tools cover major global exchanges and extend to specialized instruments like penny stocks and inverse ETFs [14]. Both the PSE and RTP tools analyze multiple timeframes, from 5-minute intervals for day traders to daily charts for swing traders [12].
| Feature | Real-Time Patterns (RTP) | Pattern Search Engine (PSE) |
|---|---|---|
| Primary Use | Intraday Trading | End-of-Day Analysis |
| Timeframes | 5m, 15m, 30m, 1h, 1d | Daily |
| Asset Coverage | Stocks, ETFs, Crypto, Forex | Stocks, Penny Stocks, ETFs, Forex |
| Pattern Count | 19–20+ | 39 |
| Price | $20/month | $30/month |
Pricing and Plans
Tickeron provides a 14-day free trial for both its Real-Time Patterns and Pattern Search Engine tools [12]. After the trial period, RTP is priced at $20 per month, while PSE costs $30 per month [12]. Subscribers to Tickeron’s AI Robots can receive monthly credits of $60 or $120, which can be applied to these tools - potentially covering the cost entirely [13].
Next, we’ll take a closer look at TradingView’s approach to AI pattern recognition.
4. TradingView
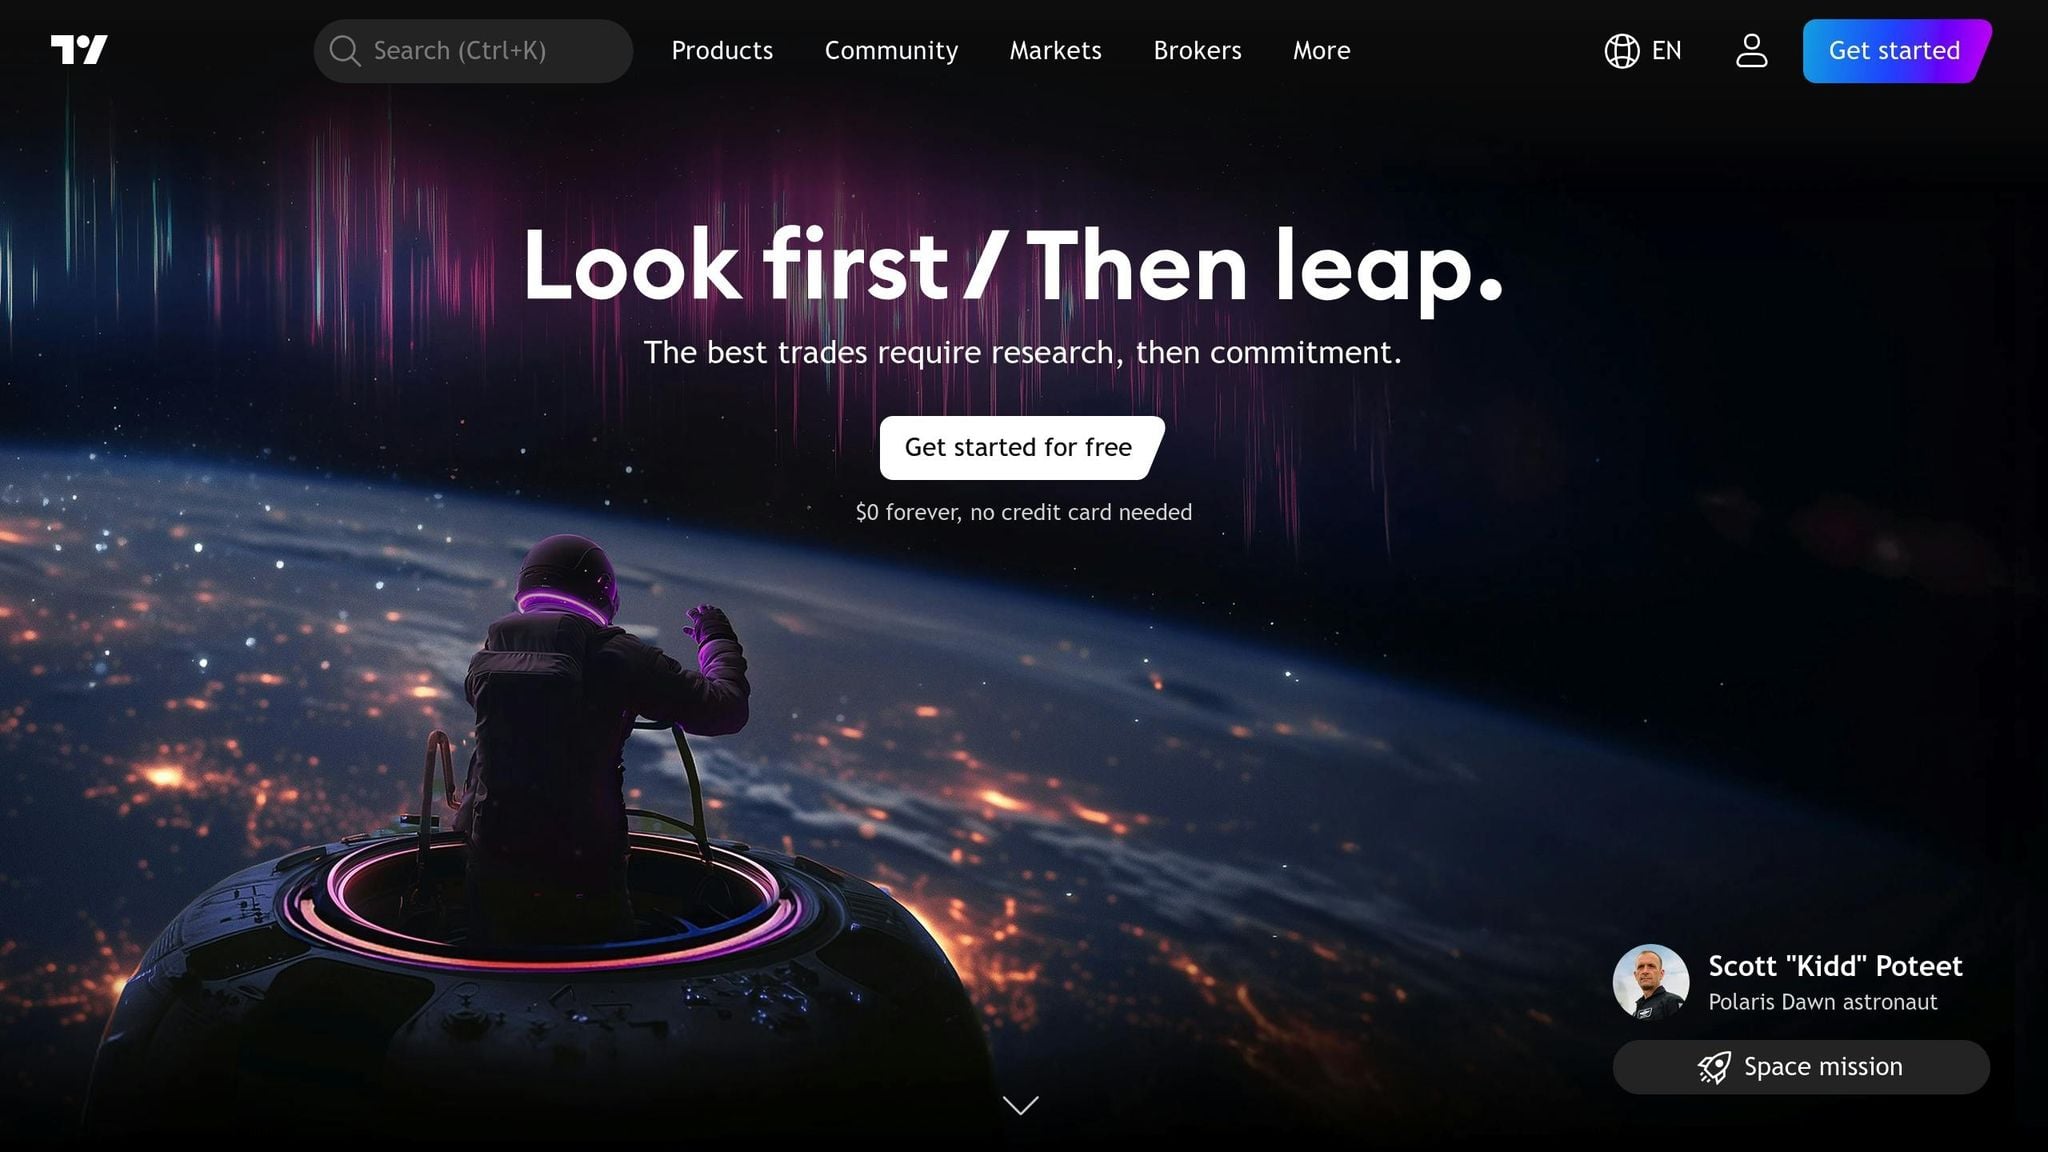
TradingView offers AI-driven pattern detection to its massive community of 100 million traders and investors [19]. The platform's built-in indicators take the guesswork out of identifying classic chart patterns, eliminating the need for time-consuming manual analysis [15].
Pattern Detection Capabilities
TradingView's AI scans the most recent 600 bars of data, analyzing pivot points within 5-candle windows to identify over 15 auto-pattern indicators, including Elliott Wave tools [15][17]. It detects a wide range of patterns, such as reversal formations like Double Top and Head and Shoulders, continuation setups like Flags and Pennants, and neutral structures like Triangles and Rectangles [16].
For traders looking to act early, an "In Progress" mode highlights patterns that are still forming. While these patterns may not always complete, they provide insights into potential market moves [17]. Additionally, the platform includes automated candlestick pattern recognition and even projects potential completion targets [17][18].
| Pattern Category | Key Patterns |
|---|---|
| Reversal | Double Top/Bottom, Triple Top/Bottom, Head and Shoulders, Inverse Head and Shoulders, Rising/Falling Wedge |
| Continuation | Bullish/Bearish Flag, Bullish/Bearish Pennant |
| Neutral | Triangle, Rectangle, Cup and Handle, Inverted Cup and Handle |
| Specialized | Elliott Wave (Impulse and Zigzag), Candlestick Patterns |
Accuracy of Signals
TradingView's automated scanners deliver a reliability rate of 60% to 80% in backtesting for common chart patterns [21]. However, the platform stresses that these tools are meant to complement - not replace - manual analysis [15][16]. Reliability improves when patterns are confirmed by additional signals, such as volume spikes at breakout points or alignment with technical indicators like RSI and MACD [16][22]. Patterns identified on higher timeframes also tend to perform better than those on shorter intervals, like 5-minute charts [22].
Asset Coverage
TradingView's pattern recognition spans its extensive database of 3,539,722 instruments, sourced from hundreds of global data feeds [19]. The tools support a diverse range of assets, including stocks from over 70 global exchanges, cryptocurrencies from centralized and decentralized platforms, forex, futures, bonds, and ETFs [19]. Beyond pattern detection, the platform boasts over 400 built-in indicators and access to more than 100,000 community-created scripts [19].
Pricing and Plans
Access to Auto Chart Pattern indicators is reserved for Premium subscribers [17][20]. While many data feeds are free, real-time quotes for certain exchanges may require additional monthly fees [19]. Free plan users can still utilize basic pattern tools and explore thousands of community-built scripts [21].
Next, we’ll dive into Trade Ideas and its unique take on AI-driven pattern recognition.
5. Trade Ideas
Trade Ideas uses its Holly AI to run millions of simulations overnight, refining its scanning criteria for the next trading day [23]. This constant adjustment ensures the platform stays aligned with recent market trends, enhancing its ability to identify patterns effectively.
Pattern Detection Capabilities
The platform employs proprietary algorithms to identify technical setups like Head and Shoulders, Triangle Tops, Broadening Bottoms, Rectangles, Double Tops, Flags, Pennants, and Pullback structures. These patterns are subjected to systematic filtering, requiring conditions such as increased volume and sustained resistance breaks to be met [24][26]. The "Chart Pattern Recognition" monitor further refines this process by applying a volatility filter of 10 cents per 15-minute interval, ensuring it highlights stocks with notable intraday movement [24].
Additional features include TradeWave, which overlays real-time buy and sell signals by optimizing EMA bands, and Stock Racing, a tool that visualizes momentum across multiple stocks in real time [23][25][28].
Accuracy of Signals
The platform's advanced detection methods deliver impressive results. Trade Ideas reports that computer-detected patterns with confirmed volume divergence achieve success rates of 65–70%, compared to 45–50% for manually identified setups [26]. The OddMaker backtesting tool allows traders to evaluate the historical performance of scans and entry signals, providing a data-driven foundation for decision-making [23]. Katie Gomez from Trade Ideas highlights that stocks with growing institutional ownership demonstrate 40% higher success rates in pattern recognition compared to those facing selling pressure [26]. She emphasizes, "Technology serves as a force multiplier for existing technical skills rather than a replacement for pattern recognition expertise" [26].
Asset Coverage
Trade Ideas focuses exclusively on the stock market, scanning thousands of equities across various sectors and timeframes [26]. By concentrating solely on equities, the platform fine-tunes its algorithms to cater specifically to stock market dynamics. It also integrates seamlessly with brokers like Interactive Brokers, CenterPoint Securities, and Cobra Trading, allowing users to act on AI-generated signals without leaving their trading platforms [25].
Pricing and Plans
Trade Ideas provides several subscription options: a free Tester version with delayed data, TI Basic for $127/month ($89/month annually), and TI Premium for $254/month ($178/month annually) [27]. The Premium plan includes access to Holly AI signals, the OddMaker backtesting tool, and the ability to monitor up to 20 charts simultaneously [27]. For traders seeking advanced capabilities, the Money Machine second-generation AI system is available for $5,000 [25].
Next, let’s delve into the pros and cons of using AI tools for chart pattern recognition.
Advantages and Disadvantages
Every AI trading tool comes with its own set of strengths and limitations. Let’s break down what some of the most popular platforms offer:
StockioAI provides real-time signals with an impressive 80–90% accuracy rate for U.S. stocks and cryptocurrencies. For $29.99/month, users get unlimited analysis, making it an affordable option. It’s particularly strong in risk management, offering features like stop-loss suggestions and confidence scoring. However, its focus is limited to U.S. equities and major cryptocurrencies, which might not suit traders looking for broader market coverage.
TrendSpider shines with its multi-timeframe analysis, which works across stocks, forex, and crypto. It automatically detects trendlines and patterns, saving traders time. That said, its premium pricing may not be ideal for those on a tighter budget.
Tickeron takes a unique approach with its Pattern Search Engine, offering over 20 different pattern types. It also features an AI bot marketplace and confidence scoring to help traders assess the likelihood of successful setups. Pricing ranges from $19.99 to $99/month, making it accessible to a range of users.
TradingView acts as a versatile charting platform, supporting both manual and automated pattern detection. It’s known for its community-driven analysis and wide asset coverage. However, for advanced AI capabilities, users often need to integrate it with additional tools.
Trade Ideas utilizes its Holly AI to automate stock picks and backtest thousands of U.S. equities overnight. Starting at $127/month, it focuses solely on equities, which may limit its appeal to traders looking for multi-asset analysis.
Each platform has its nuances, but one universal truth stands out: precise chart preparation is key to improving signal reliability. Removing background grids, indicator lines, and trend lines can help avoid false signals during analysis [1]. Similarly, zooming in too much can exaggerate candlestick patterns, while zooming out too far might cause you to miss critical details [1].
"The AI's pattern recognition is incredibly sophisticated. It catches nuances that even experienced traders miss." – Marcus Chen, Hedge Fund Analyst, Tickrad [29]
Tickrad further sets itself apart by analyzing charts up to 60 times faster than manual methods [29].
Ultimately, the best choice depends on your trading focus, budget, and technical needs. For stock-only traders, platforms like Trade Ideas are a solid pick. On the other hand, multi-asset traders might find more value in tools that optimize crypto trading algorithms alongside stock analysis. Free plans, such as StockioAI's 5-signal limit, are great for testing but may not suffice for active trading.
Conclusion
Selecting the right AI pattern recognition tool comes down to your trading style, budget, and the markets you focus on. If you're just starting out and want to test the waters for free, TradingView is a great option. It identifies around 40 candlestick patterns at no cost, making it a useful tool for building your pattern-recognition skills without any financial risk [11].
For those looking for affordable daily signals, Tickeron offers a budget-friendly solution at just $60 per year (or $5 per month). On the other hand, active day traders who need more frequent updates might find StockioAI's Premium plan appealing. At $29.99 per month, it provides unlimited signals with 80–90% accuracy for U.S. stocks and cryptocurrencies, as well as 4-hourly crypto analysis and daily stock updates.
If your focus is on U.S. equities and you have a larger budget, Trade Ideas is worth considering. Starting at $89 per month, it offers robust overnight backtesting across thousands of stocks. For traders who work across multiple asset classes like stocks, forex, and crypto, TrendSpider provides advanced multi-timeframe analysis for about $54 per month (billed annually).
For those with limited budgets, StockioAI's free tier is a solid starting point. It includes 5 AI trading signals, which function as real-time AI signals for entry and exit points, allowing you to test its pattern recognition capabilities on assets like Bitcoin, Ethereum, Solana, and XRP.
Ultimately, the best platform for you will depend on how well its features and pricing align with your trading goals and needs.
FAQs
How does AI enhance the accuracy of stock chart pattern recognition?
AI brings a new level of precision to stock chart pattern recognition by using machine learning, deep learning, and computer vision technologies. These advanced systems process massive amounts of price data in real time, spotting patterns faster and more accurately than any human could.
Unlike humans, AI doesn't suffer from fatigue, bias, or subjective interpretation. This consistency ensures more reliable pattern detection, empowering traders to make data-backed decisions with increased confidence and efficiency.
What are the key advantages of using AI-driven tools for stock and crypto trading?
AI-powered trading tools bring a whole new level of efficiency to the trading world. These tools can process massive amounts of data - like price movements, trading volume, and market trends - in just seconds, delivering real-time Buy, Sell, and Hold signals. In fast-paced markets such as stocks or cryptocurrencies, this speed can make all the difference, enabling traders to act swiftly and stay ahead of the curve.
Another game-changer? AI tools remove the emotional rollercoaster that often comes with manual trading. Fear and greed are common culprits behind poor decisions, but AI relies on objective algorithms to maintain consistent and disciplined strategies. Plus, these systems never sleep - they monitor multiple assets and timeframes around the clock, ensuring no opportunity slips through the cracks.
Take platforms like StockioAI, for example. They go beyond just data analysis by offering advanced risk management features, such as position-sizing calculators and stop-loss recommendations, right within their workflows. These built-in tools help traders safeguard their capital while scaling their strategies with confidence. With their unmatched speed, precision, and safeguards, AI trading tools are transforming how traders approach the markets, making the process smarter and more dependable than ever before.
Who can benefit the most from using AI tools for stock chart pattern recognition?
AI-powered tools for recognizing stock chart patterns have become a game-changer for traders of all types. Day traders and scalpers can rely on the speed and precision of AI to identify patterns like triangles, flags, or head-and-shoulders within seconds. This eliminates the delays and mental strain that often come with manual analysis. For swing traders and position traders, these tools offer the advantage of monitoring multiple time frames simultaneously, delivering real-time buy, sell, or hold signals. This helps them spot medium-term trends and avoid missing critical reversals.
For novice traders, AI provides unbiased, data-driven insights that help cut down on emotional decision-making and speed up the learning process. Meanwhile, professional and institutional traders find these tools essential for managing large portfolios. AI processes real-time data - like technical indicators, trading volume, and market sentiment - to deliver precise entry and exit points, all while supporting sophisticated risk management strategies. In short, these tools equip traders at every level with the insights they need to navigate fast-moving markets with confidence.