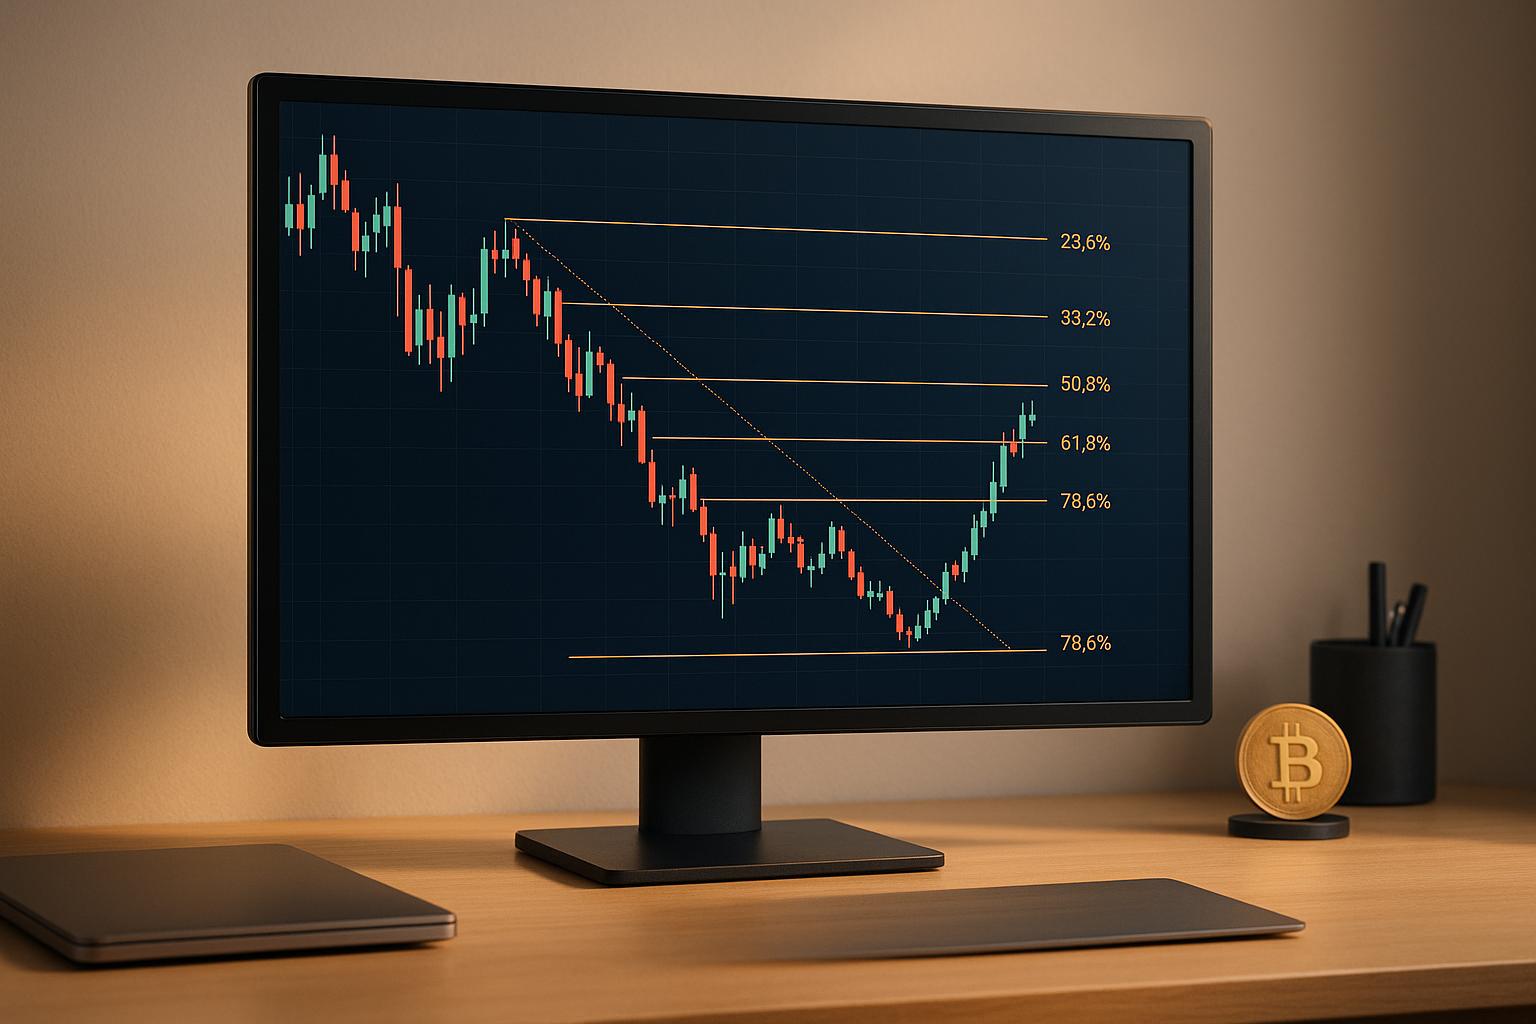
Fibonacci tools help crypto traders identify potential price levels for reversals, support, and resistance. These levels, derived from the Fibonacci sequence, are widely used to plan entries and exits during pullbacks or trends. Key retracement levels include 23.6%, 38.2%, 50%, 61.8%, and 78.6%, with the "golden zone" (50%-61.8%) being particularly important for finding strong entry points. Extension levels like 100%, 161.8%, and 261.8% project profit targets during trends.
Key Takeaways:
-
Retracement Levels: Used for identifying pullbacks and entry points.
-
Extension Levels: Help project profit targets beyond current price ranges.
-
Golden Zone: The 50%-61.8% retracement area is often a reliable entry zone.
-
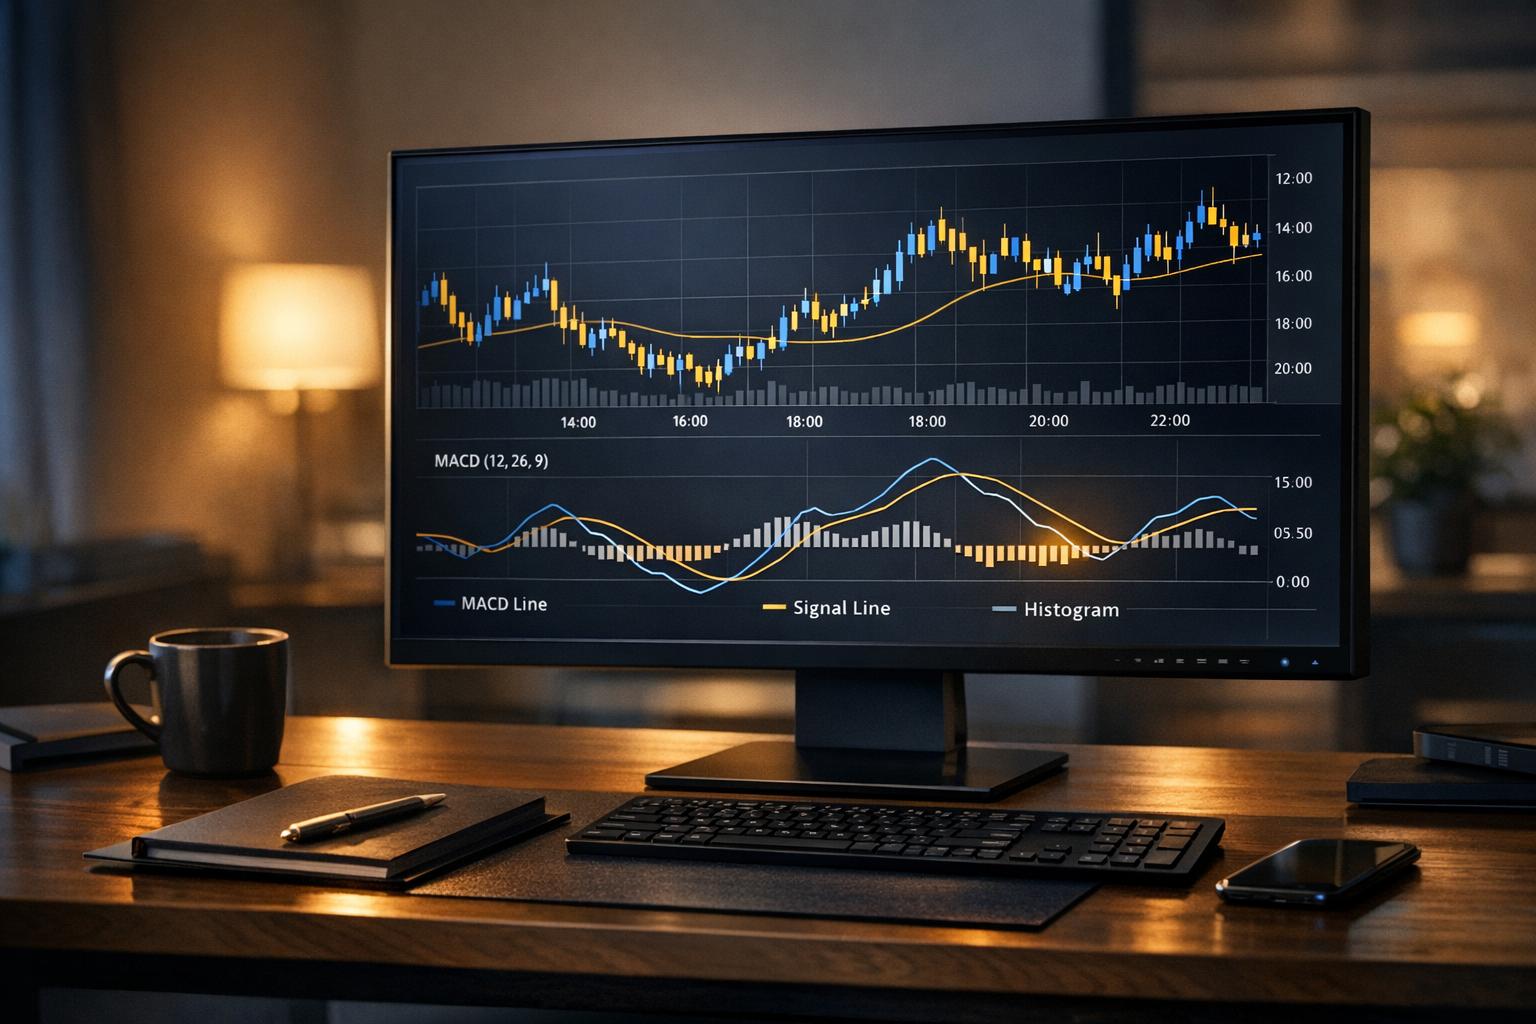
Confirmation Tools: Combine Fibonacci with indicators like RSI, MACD, and volume analysis to strengthen trade setups.
-
AI Tools: Platforms like StockioAI enhance Fibonacci strategies with automated analysis, risk management tools, and real-time data insights.
Fibonacci tools are most effective in trending markets and require clear swing high/low points for accuracy. Always confirm signals with additional indicators to reduce false entries and improve trading outcomes.
The Ultimate Fibonacci Retracement Trading Strategy Course!
Fibonacci Retracement and Extension Basics
Now that we’ve covered the math behind Fibonacci, let’s dive into how retracement and extension tools can guide crypto trading decisions. These two tools work hand in hand: Fibonacci retracement helps you identify potential bounce points during price pullbacks, while Fibonacci extension projects where prices might head during strong trends.
Both tools rely on the same key ratios derived from the Fibonacci sequence but are applied differently to pinpoint entry and exit strategies. Think of retracement as your entry guide and extension as your exit target - a dynamic duo for navigating crypto’s often unpredictable price swings.
Key Fibonacci Levels and What They Mean
Fibonacci retracement levels highlight likely support and resistance zones where crypto prices tend to pause, reverse, or consolidate during pullbacks. Here’s a breakdown of the key levels and what they reveal about market behavior:
-
23.6% retracement: Suggests a shallow pullback, often seen in strong trends.
-
38.2% retracement: Indicates a moderate pullback, which can offer early entry opportunities, though it’s less dependable in crypto’s highly volatile markets.
-
50% retracement: While not a Fibonacci number, this level is a psychological midpoint where bulls and bears often battle for control.
-
61.8% retracement: Known as the "golden ratio", this is one of the most critical levels, providing strong support during pullbacks.
-
78.6% retracement: Reflects deeper corrections, signaling either trend exhaustion or major support during sharp downturns.
On the other hand, Fibonacci extension levels project price targets beyond the current range. For example, the 100% extension equals the length of the original move, the 161.8% extension is often the first major profit target, and the 261.8% extension is used for ambitious targets, especially during explosive breakouts or strong trends.
Retracement vs. Extension: Key Differences
Understanding when to use retracement versus extension tools can make a big difference in your trading strategy:
-
Retracement tools focus on corrections within an ongoing trend. They help you identify where prices might find support or resistance during short-term pullbacks, answering the question: "Where could this pullback end, so I can enter the trade?"
-
Extension tools are used to project price targets beyond the current range. They help you decide: "If the trend continues, where might it go, so I can exit profitably?"
Here’s how they work in practice: For retracement, you draw levels from a swing low to a swing high (in an uptrend) or vice versa in a downtrend. Then, wait for the price to pull back to one of these levels to evaluate an entry. For extension, use the same swing points to project price targets beyond the current high or low, helping you set profit-taking levels. Retracement is your tool for pullbacks, while extension is your guide for trend continuations.
| Tool | Purpose | Key Levels | Best Used For |
|---|---|---|---|
| Retracement | Identify pullbacks (support/resistance) | 23.6%, 38.2%, 50%, 61.8%, 78.6% | Entry points, stop-loss placement |
| Extension | Project price targets beyond current range | 100%, 161.8%, 200%, 261.8% | Profit targets, trend continuation |
Requirements Before Using Fibonacci
Before applying Fibonacci tools, it’s crucial to get the basics right. Here are three fundamentals to master:
-
Clear Swing Highs and Swing Lows
Start by identifying clear swing highs (price peaks) and swing lows (price troughs). Reliable Fibonacci levels depend on significant, easily identifiable swing points. Avoid relying on minor price fluctuations or market noise - they can lead to inaccurate levels. -
Trend Identification
Fibonacci tools are most effective in trending markets. Determine whether the trend is upward, downward, or sideways before applying Fibonacci analysis. In an uptrend, look for buying opportunities during pullbacks; in a downtrend, use these levels to spot potential selling opportunities. -
Reliable Charting Platforms
Use professional charting platforms - like StockioAI - that automatically calculate and display Fibonacci levels once you select your swing points. These platforms often let you save your analysis, set alerts for key levels, and combine Fibonacci tools with other indicators for a complete trading view.
Lastly, always assess the market environment. Fibonacci tools shine in clear trending markets but may be less effective during consolidation phases or extreme volatility.
How to Apply Fibonacci Tools in Crypto Trading
When it comes to trading cryptocurrencies, Fibonacci tools can be incredibly useful for identifying key levels for entries and exits. By following a systematic approach with clear swing points and confirmatory signals, you can improve your chances of success.
Using Fibonacci Retracement for Entry Points
Drawing Fibonacci retracement levels accurately is crucial for finding strong entry points. Start by identifying clear swing highs and lows on your crypto chart - these should be the most noticeable recent peak and trough.
Once you've pinpointed these levels, apply the Fibonacci tool by dragging it from the swing low to the swing high (or the reverse in a downtrend). This will automatically plot key retracement levels, including 23.6%, 38.2%, 50%, 61.8%, and 78.6%.
For example, if Bitcoin moves from $30,000 (swing low) to $40,000 (swing high), the 61.8% retracement level would be around $33,820. A bullish reversal at this level could signal a long entry, with a stop-loss placed slightly below it.
Focus on the 50% and 61.8% levels, as these zones often act as strong support in uptrends or resistance in downtrends. However, don’t rely solely on these levels - always confirm with price action signals like pin bars, engulfing patterns, or volume spikes. Combining Fibonacci retracements with other indicators, such as RSI or MACD, can further enhance your strategy and increase the likelihood of a successful trade.
Using Fibonacci Extension for Exit Points
After identifying entry points, the next step is to plan your exit strategy using Fibonacci extension levels. These levels help project profit targets beyond the current price range. To use this tool, you'll need three key points:
-
The swing low (point 1)
-
The swing high (point 2)
-
The retracement low after the pullback (point 3)
Using your platform’s Fibonacci extension tool, connect these points in sequence. The tool will then plot extension levels above the swing high (in uptrends) or below the swing low (in downtrends). Common extension levels include 100%, 161.8%, 200%, and 261.8%.
The 161.8% extension is often the first major profit target, especially during strong trends. For more aggressive targets during significant breakouts, levels like 200% or 261.8% can guide longer-term trades. Many traders take partial profits at the 100% and 161.8% levels, leaving a smaller position open for higher targets. This approach balances locking in gains while still capitalizing on potential larger moves.
Improving Fibonacci Analysis with StockioAI
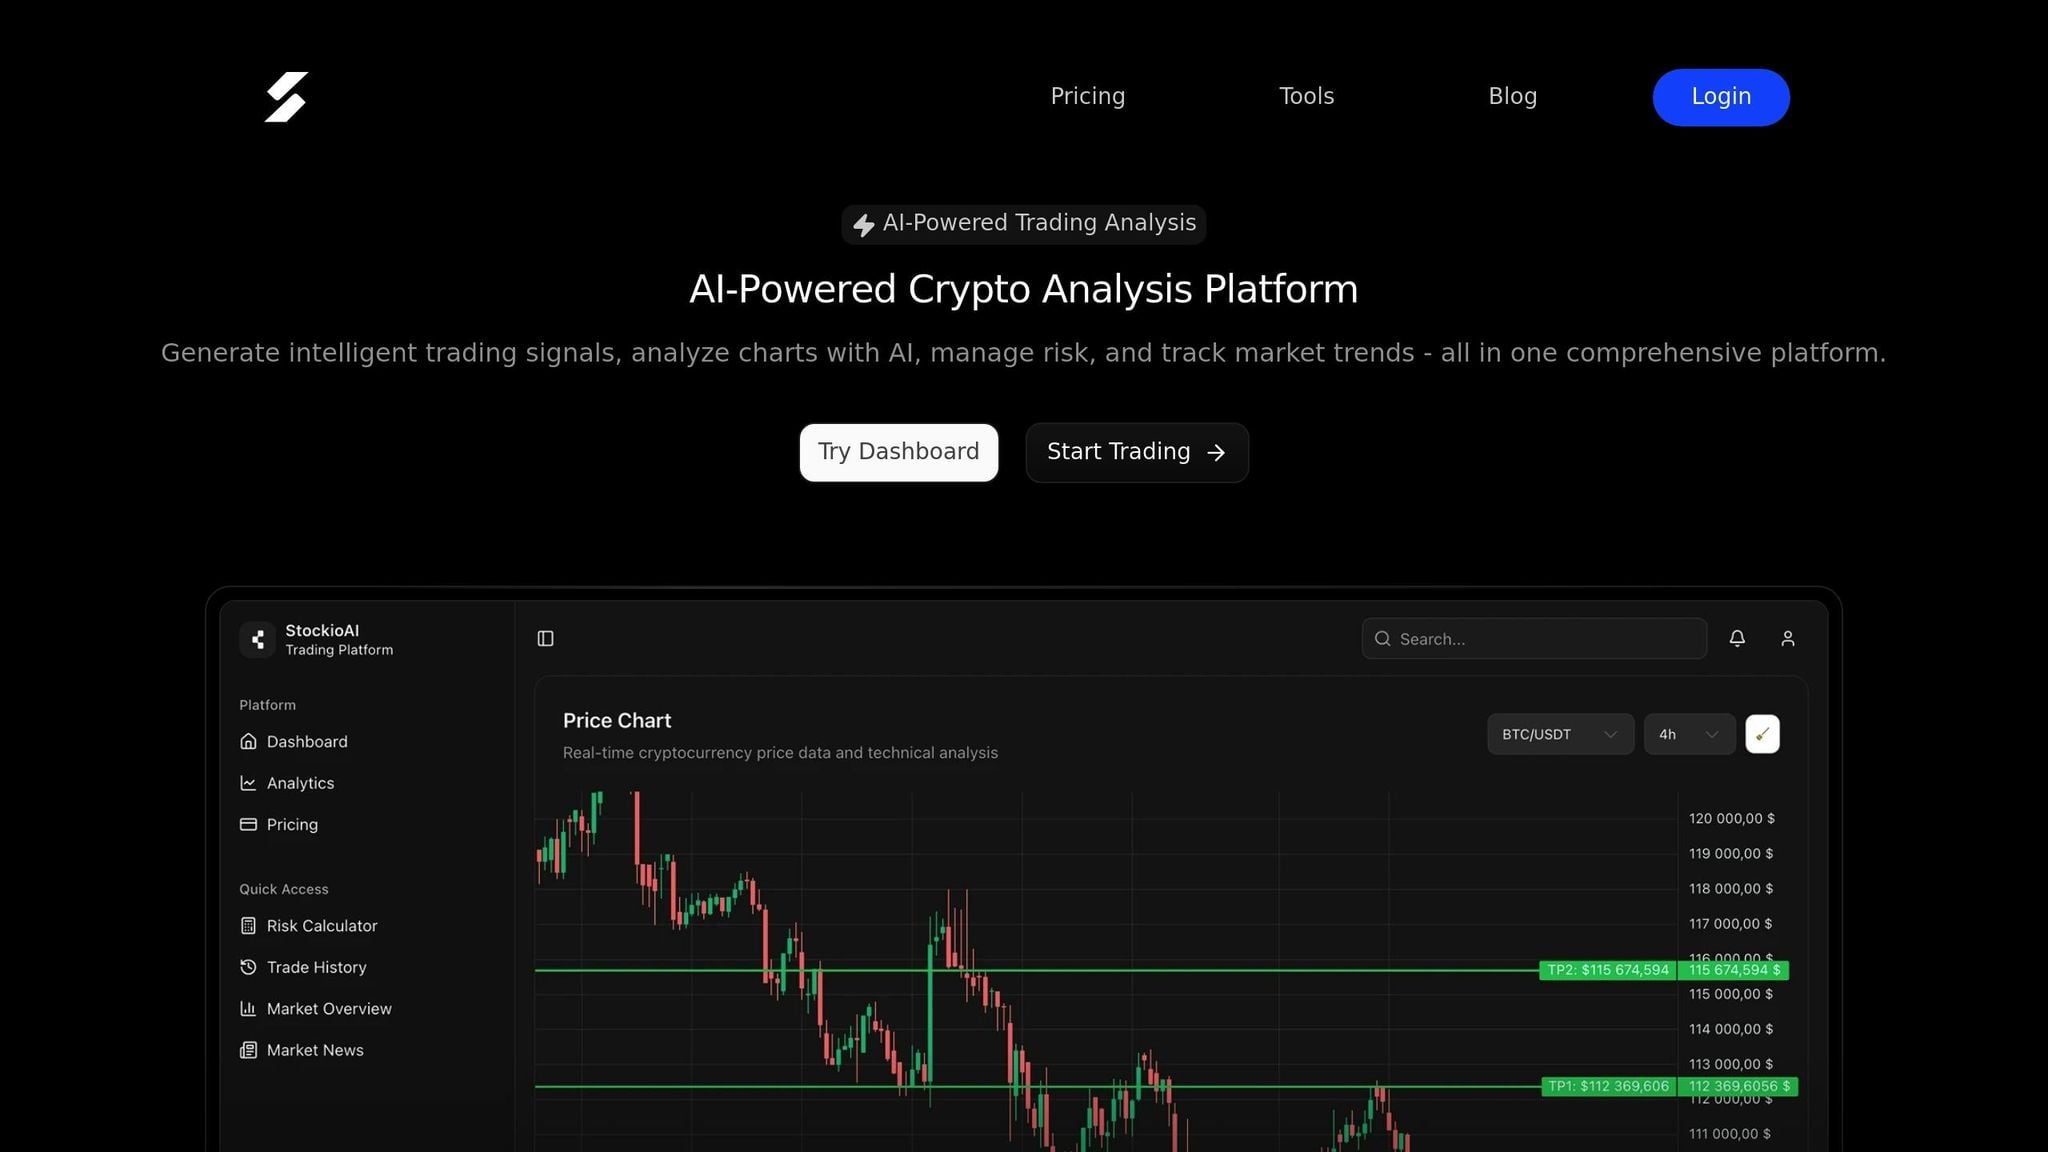
To refine your Fibonacci analysis, consider integrating AI-driven tools like StockioAI into your trading process. StockioAI offers features designed to complement and enhance manual analysis, making your strategies more precise and efficient.
The platform’s Interactive Chart Analysis provides advanced TradingView charts with AI-generated support and resistance zones, technical indicators, and trading levels. These tools can validate or supplement your manually drawn Fibonacci levels, giving you added confidence in your analysis.
With the AI Pattern Recognition feature, StockioAI uses machine learning to identify chart patterns, trend reversals, and optimal entry and exit points. This helps confirm reversal zones, ensuring you’re not relying solely on Fibonacci levels but also leveraging AI-driven insights for added accuracy.
StockioAI also generates BUY/SELL/HOLD signals with detailed entry points, stop-loss levels, and profit targets, all backed by confidence scores. These recommendations align with Fibonacci-based strategies, providing an extra layer of validation. The system processes over 60 real-time data points per second, including volume patterns, market sentiment, and technical indicators.
For risk management, the platform’s Risk Calculator is a game-changer. It calculates optimal position sizes, stop-loss levels, and leverage based on your Fibonacci-derived entry and exit points, helping you manage risk effectively.
Additionally, StockioAI’s multi-timeframe analysis aligns Fibonacci levels with broader market trends. By prioritizing higher timeframe momentum, this feature ensures that your Fibonacci analysis is consistent with the overall trend structure.
Fibonacci Trading Strategies for Crypto Markets
Refine your Fibonacci strategies by blending them with other technical indicators to create higher-probability trading setups.
Combining Fibonacci with Other Indicators
To get the most out of Fibonacci retracements, pair them with additional signals to sharpen your strategy. The golden zone, located between the 50% and 61.8% retracement levels, gains even more significance when supported by other technical indicators. The goal? Confluence - when multiple tools align at key Fibonacci levels, signaling stronger trade opportunities.
Moving averages are a great complement to Fibonacci analysis. For example, if the price retraces to the 61.8% level and stays above a key moving average, like the 50-day or 200-day, it suggests a potential bullish reversal. On the other hand, if the retracement happens below these moving averages, it could indicate continued downward momentum.
RSI (Relative Strength Index) helps avoid poorly timed entries. A strong long trade setup might include a bounce at the 61.8% Fibonacci level, a bullish engulfing candle, support above the 50-day moving average, and an RSI reading below 70 (to avoid overbought conditions). This layered approach reduces the risk of acting on false signals that sometimes occur when relying only on Fibonacci levels.
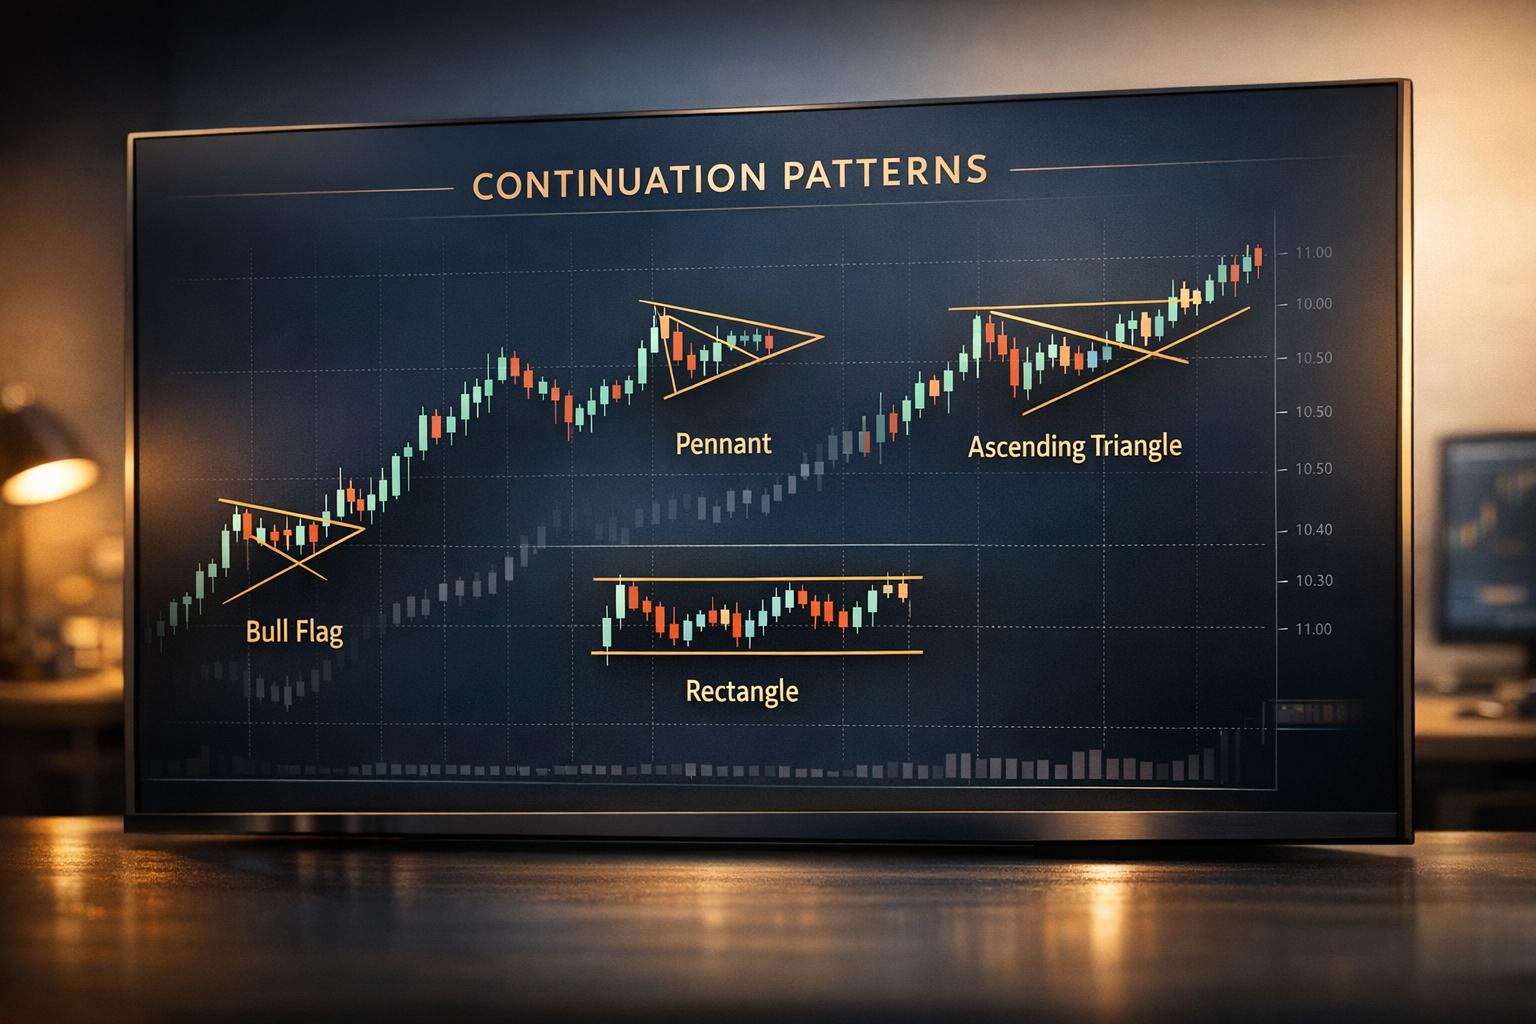
Candlestick patterns offer critical price action clues at Fibonacci retracement zones. Reversal patterns like hammers, bullish engulfing candles, or dojis at these levels can signal that buyers are stepping in, increasing the likelihood of a favorable price move.
Volume analysis adds another layer of confirmation. When a bounce from a Fibonacci level is accompanied by strong volume, it indicates genuine buying interest. On the flip side, weak volume may suggest a false breakout. Pay close attention to volume spikes near the golden zone (50%-61.8%).
Keep your charts clean by focusing on 2–3 key indicators that align with your Fibonacci analysis. Too many indicators can clutter your chart and make decision-making harder. Up next, let’s see how AI tools can take these strategies even further.
Using StockioAI for Strategy Validation
To strengthen your Fibonacci strategies, StockioAI offers AI-driven tools that validate and refine your setups. While Fibonacci levels highlight key price zones, StockioAI adds data-driven insights to confirm or challenge your analysis.
The platform's AI Pattern Recognition feature uses machine learning to detect chart patterns and trend reversals. These insights help validate your manually drawn Fibonacci levels, reducing the risk of subjective errors.
StockioAI’s interactive chart analysis generates AI-driven support and resistance zones that often align with Fibonacci retracements. For example, when an AI-identified support zone matches your 61.8% Fibonacci level, it boosts confidence in the trade setup.
The platform also provides BUY, SELL, and HOLD signals, complete with entry points, stop-loss levels, and profit targets. These signals come with confidence scores, offering a clear assessment of whether your Fibonacci-based strategy aligns with market conditions. Its multi-timeframe analysis ensures that your Fibonacci levels are consistent with broader market trends, prioritizing higher timeframe momentum for better decision-making.
For risk management, StockioAI’s Risk Calculator calculates optimal position sizes and leverage based on your Fibonacci-derived entry and exit points. This ensures you manage risk effectively while maximizing the potential of your strategy.
StockioAI’s 7-Tier Priority System evaluates factors like market structure, volume, liquidity, RSI and MACD signals, EMA ribbons, SMA context, and price momentum. This comprehensive framework ensures your Fibonacci levels align with favorable market conditions.
"StockioAI revolutionized my trading strategy. The AI insights helped me achieve consistent 18% monthly returns." - Jordan Martinez, Quantitative Trader [4]
StockioAI offers flexible pricing options to suit different trading needs. The Professional plan, priced at $99/month, includes 300 AI trading signals per month, advanced pattern recognition, portfolio tracking, API access, and priority support - perfect for active traders looking to integrate AI validation into their Fibonacci strategies.
Pros and Cons of Fibonacci Tools in Crypto Trading
Now that we've seen how Fibonacci tools can guide entry and exit strategies, it's time to weigh their strengths and challenges. Like any trading tool, Fibonacci retracement and extension levels come with their own set of benefits and drawbacks. Understanding these can help you use them more effectively in your crypto trading strategy.
Benefits of Fibonacci Tools
Fibonacci tools offer a structured way to identify key support and resistance levels. Unlike subjective trend lines or support zones, these tools provide consistent reference points, helping traders make more objective decisions.
Another advantage is their relevance in the highly volatile crypto market. Fibonacci levels often align with areas of significant liquidity and interest, where institutional and retail traders alike tend to place orders. This widespread use can even create a self-fulfilling effect, as many traders act on these levels[1].
They also enhance risk management by pinpointing logical areas for stop-loss and take-profit orders. Since Fibonacci retracement levels are static once drawn, they allow for consistent planning. Unlike moving averages, which shift with every new price bar, Fibonacci levels remain fixed, making it easier to set alerts and prepare trades in advance[1][3].
Limitations and Common Mistakes
One of the biggest hurdles in using Fibonacci analysis is the subjectivity involved in selecting swing points. Two traders analyzing the same chart might choose different highs and lows, resulting in different Fibonacci levels[2].
In choppy or sideways markets, these levels can sometimes generate false signals. Prices may cross through Fibonacci levels without any meaningful reaction, leading to misleading trade entries[1].
Relying solely on Fibonacci levels without confirmation from other technical indicators or price action can also lead to poor decisions. For example, entering a trade based only on a Fibonacci level - without signals like bullish candlestick patterns or rising volume - can increase the risk of losses[2].
Common mistakes include applying Fibonacci levels to minor or insignificant price swings and overcrowding charts with too many levels. This can lead to "analysis paralysis", making it harder to make clear decisions[2].
Comparison Table: Pros and Cons
| Advantages | Limitations |
|---|---|
| Provides clear support/resistance levels | Swing point selection can be subjective |
| Works well in volatile markets | May generate false signals in sideways markets |
| Enhances risk management with defined stops and targets | Overreliance without confirmation can lead to losses |
| Widely recognized and used by traders | Needs additional indicators for validation |
| Easy to apply using trading platforms | Overuse can clutter charts and confuse analysis |
To get the most out of Fibonacci tools, combine them with other confirmation signals and a solid risk management plan. This balanced approach can help you navigate the complexities of crypto trading more effectively.
Conclusion: Mastering Fibonacci in Crypto Trading
Fibonacci tools are a powerful way to pinpoint key support and resistance levels in crypto trading. The journey to mastering Fibonacci starts with identifying significant swing points, concentrating on dependable levels (like the 0.5–0.618 zone), and confirming these with other technical signals.
The key to success lies in three fundamental steps: selecting meaningful swing points, focusing on trusted Fibonacci levels, and always validating your analysis with additional indicators. The best traders don’t rely on Fibonacci alone - they combine it with tools like price action signals, volume analysis, and momentum indicators to build a well-rounded trading strategy. By blending these timeless principles with cutting-edge AI tools, traders can create a more resilient and effective framework.
Platforms like StockioAI take this approach further by leveraging real-time data to validate Fibonacci levels. StockioAI processes over 60 real-time data points per second to confirm Fibonacci-based entry and exit points with AI-generated support and resistance zones[4]. This combination illustrates how Fibonacci analysis and AI can work together seamlessly.
StockioAI also simplifies risk management with its Risk Calculator, helping traders determine ideal position sizes and stop-loss levels at key Fibonacci zones. Its AI Pattern Recognition and multi-timeframe analysis ensure that your Fibonacci setups align with broader market trends, reducing the likelihood of false signals.
The golden rule? Consistency over complexity. Stick to clear swing points, focus on reliable levels, and prioritize strict risk management. Whether you’re planning entries around the 61.8% retracement or targeting profits at the 161.8% extension, disciplined execution and regular practice are essential. Start with the basics, refine your skills on historical charts, and gradually incorporate advanced tools like StockioAI to take your trading to the next level.
FAQs
How can I use Fibonacci tools with other indicators to improve my crypto trading strategy?
To make the most of Fibonacci tools in your crypto trading strategy, pair them with other indicators such as moving averages, RSI (Relative Strength Index), or MACD (Moving Average Convergence Divergence). For instance, Fibonacci retracement levels can help you spot potential support and resistance zones, while RSI can confirm whether an asset is overbought or oversold at those levels.
Using a combination of tools gives you more clarity and confidence in making entry and exit decisions. However, it's important to note that no single indicator can guarantee success. Always factor in market conditions and stick to sound risk management practices. Platforms like StockioAI can simplify this process by providing real-time technical analysis and AI-driven insights tailored to your trading approach.
What are the risks of using only Fibonacci retracement and extension levels in crypto trading?
Relying exclusively on Fibonacci retracement and extension levels in crypto trading can be a gamble, especially given the market's unpredictable swings. While these tools are useful for spotting potential support and resistance levels, they are far from foolproof.
Crypto markets are notorious for sudden price shifts and unexpected news events that can throw Fibonacci levels off course. To navigate these challenges, it’s smart to pair Fibonacci tools with other technical indicators, broader market analysis, and a well-thought-out risk management plan. A diversified approach not only strengthens your decision-making but also reduces the risks of placing too much trust in a single strategy.
How can AI tools like StockioAI enhance Fibonacci-based trading strategies in crypto?
AI-driven tools like StockioAI take Fibonacci-based trading to the next level by offering real-time trading signals, in-depth technical analysis, and AI-powered pattern recognition. These capabilities allow traders to pinpoint potential entry and exit points with much greater precision.
StockioAI processes massive volumes of market data in an instant, delivering actionable insights such as Buy, Sell, and Hold signals that are customized to current market conditions. This helps traders make smarter decisions and manage risks more effectively when applying Fibonacci retracement and extension techniques in crypto trading.