Historical data is the backbone of crypto predictions. By analyzing past price movements, trading volumes, and market trends, traders and AI models can identify patterns and make informed decisions. Advanced tools like StockioAI use algorithms such as ARIMA, LSTM, and GRU to process this data and provide actionable insights, including BUY, SELL, and HOLD signals. These methods have shown high accuracy, with some models achieving over 99% precision in short-term Bitcoin forecasts.
Key takeaways:
-
Historical data includes price, volume, and technical indicators like RSI and MACD.
-
AI models like ARIMA and LSTM identify patterns for forecasting.
-
Platforms combine historical data with real-time analytics for precise predictions.
-
Benefits include improved decision-making and risk management, though challenges like unpredictable events and overfitting exist.
Using historical data effectively requires clean datasets, proper feature engineering, and continuous model updates to adapt to changing market conditions. Tools like StockioAI simplify this process for traders by blending historical insights with real-time analysis.
Main Techniques for Using Historical Data in Predictions
Time Series Analysis for Crypto Markets
Time series analysis focuses on sequential price data to anticipate short-term market movements. Among the numerous methods available, ARIMA (AutoRegressive Integrated Moving Average) is a standout for short-term crypto forecasting.
For example, ARIMA(6,1,12) has demonstrated impressive results, achieving 99.94% accuracy in 7-day Bitcoin forecasts and 95.84% accuracy over 30-day predictions[2]. Another popular method, PROPHET, sometimes outperforms ARIMA under specific market conditions. Both models are particularly adept at identifying seasonal trends, cyclical patterns, and recurring market momentum. However, their accuracy tends to decline when applied to longer-term forecasts because of the unpredictable nature of cryptocurrencies and their sensitivity to external events.
ARIMA is particularly effective for daily and weekly price predictions, helping traders spot sequential patterns. By analyzing historical data such as open, high, low, close prices, and trading volume, traders can use these models to refine their entry and exit strategies. From here, we move into machine learning models, which build upon these time series fundamentals for even greater precision.
Machine Learning Models for Prediction
Machine learning models bring a new level of sophistication to market predictions, especially in volatile environments like cryptocurrency. LSTM (Long Short-Term Memory) networks, for instance, are designed to capture long-term dependencies in data, making them a strong choice for crypto markets. Research shows LSTMs can achieve up to 72% accuracy in predicting upward trends for Ethereum and Ripple, though their performance is less consistent with Bitcoin due to its extreme volatility[6].
Another option is the GRU (Gated Recurrent Unit), which offers computational efficiency while maintaining accuracy. GRU models have achieved MAPE values as low as 0.035 for Bitcoin forecasting[3]. For a different approach, XGBoost, a gradient boosting algorithm, excels at handling structured historical data, especially when multiple features like price, volume, and technical indicators are included.
The Temporal Fusion Transformer (TFT) represents cutting-edge machine learning. With advanced configurations like additional hidden layers and normalization techniques, TFT models consistently outperform simpler architectures. They are particularly effective when processing multivariate datasets that incorporate factors such as market sentiment and external influences[6].
Platforms like StockioAI leverage these advanced models to analyze over 60 real-time data points every second. By identifying chart patterns and potential trend reversals, the platform provides actionable recommendations - BUY, SELL, or HOLD - backed by detailed reasoning and confidence scores. StockioAI boasts a 75.0% win rate and a profit factor of 2.95[1].
"StockioAI revolutionized my trading strategy. The AI insights helped me achieve consistent 18% monthly returns." - Jordan Martinez, Quantitative Trader[1]
These models show even greater potential when paired with technical indicators and historical data.
Combining Technical Indicators with Historical Data
Integrating technical indicators with machine learning models significantly enhances prediction accuracy. Indicators like EMA (Exponential Moving Average), RSI (Relative Strength Index), and MACD (Moving Average Convergence Divergence) reveal market momentum, trend strength, and potential reversal points - insights that raw price data alone might overlook.
Studies indicate that combining technical indicators with ARIMA models can improve short-term Bitcoin forecasts beyond what either approach achieves on its own[2]. This hybrid strategy allows models to interpret both statistical patterns and the behavioral psychology embedded in technical analysis.
Feature engineering plays a pivotal role in this process. By deriving new variables from raw historical data - such as volatility, momentum, and correlation patterns - traders can provide machine learning models with richer datasets. This transforms basic price data into actionable market intelligence.
StockioAI exemplifies this approach by analyzing momentum indicators, support and resistance levels, volume trends, and market patterns simultaneously. The key to success lies in using technical indicators as input features rather than standalone signals. This approach enables machine learning algorithms to adaptively weigh different indicators based on market conditions, creating systems that perform consistently across diverse cryptocurrency environments.
Crypto Forecasting using LSTM RNN in a Python Streamlit App
| Is it any good?
Step-by-Step Guide to Building a Predictive Model
Creating a cryptocurrency prediction model involves turning raw historical data into actionable insights. This process is broken down into three essential phases, each playing a critical role in determining the model's effectiveness in real trading environments.
Collecting and Preparing Historical Data
The backbone of any successful predictive model lies in the quality of its historical data. Reliable sources like CryptoDataDownload, CoinMarketCap, or exchange APIs provide key data points, including open, high, low, and close prices, as well as trading volume.
To ensure accuracy, clean the dataset by addressing missing values - use forward-fill for short gaps or interpolation for longer ones - and remove any obvious outliers that are likely data errors instead of genuine market patterns. Synchronize timestamps to Eastern Time (MM/DD/YYYY HH:MM:SS) and maintain consistent intervals. While daily closing prices are often sufficient, advanced strategies might benefit from hourly data. Keep all prices formatted in USD with proper thousand separators (e.g., $1,234.56) for consistency.
Next, normalize the price data using techniques like min-max scaling or z-score standardization to optimize algorithm performance. Organize the data chronologically, using older records for training and more recent ones for testing to avoid lookahead bias. Once the data is clean and standardized, you can start transforming raw numbers into meaningful features.
Feature Engineering and Model Training
Feature engineering is where raw data becomes predictive signals. By calculating technical indicators like EMA, MACD, and RSI, you can capture trends and market momentum.
You can further enhance your dataset by adding lagged features, such as the previous day’s prices, rolling averages (e.g., a 7-day moving average), and volatility metrics over different timeframes. These features, which range from momentum indicators to volume ratios, help improve the model’s accuracy.
The choice of model depends on your prediction goals and the complexity of the task. For short-term forecasts, ARIMA models work well. For instance, an ARIMA(6,1,12) configuration achieved over 99% accuracy for 7-day Bitcoin predictions[2]. For more complex patterns, LSTM networks excel at capturing long-term dependencies[6], while XGBoost often delivers high precision with multiple features, achieving near-perfect R² scores when fine-tuned[7].
Use an 80:20 train-test split to evaluate your model. To avoid overfitting, apply regularization techniques like L1/L2 penalties in XGBoost or dropout layers in neural networks. Keep an eye on your validation performance and stop training when it plateaus to maintain a balanced model.
Testing and Validating Predictive Models
Once trained, the model’s performance must be rigorously tested. Use a variety of evaluation metrics to get a full picture. Metrics like Root Mean Squared Error (RMSE) and Mean Absolute Error (MAE) measure prediction accuracy in dollar terms, while Mean Absolute Percentage Error (MAPE) provides insights into percentage-based accuracy. The R² score helps gauge how much of the price variation your model can explain.
Cross-validation is key to understanding your model’s reliability across different market conditions, such as bull, bear, and sideways trends. If the model performs significantly better on training data than on test data, it may be overfitting. In such cases, simplify the model or expand the dataset.
Real-world validation is the ultimate test. For example, StockioAI achieves a 75.0% win rate and a 2.95 profit factor in live trading scenarios[1]. The platform processes over 60 real-time data points per second, continuously validating its models against current market conditions.
To assess your model’s real-world performance, track positions and analyze profits and losses. Use risk-adjusted metrics like maximum drawdown, the Sharpe ratio, and average holding periods to uncover weaknesses that traditional accuracy metrics might overlook.
Because cryptocurrency markets evolve quickly, ongoing monitoring is crucial. Set up automated systems to track performance and alert you if the model’s accuracy falls below acceptable thresholds. This ensures your predictive model stays effective in dynamic market conditions.
Benefits and Drawbacks of Historical Data in Predictions
Using historical data can provide a strong foundation for predictions, but it also comes with challenges that may influence trading outcomes.
Benefits of Historical Data
Historical data for major cryptocurrencies like Bitcoin and Ethereum is extensive, offering millions of data points collected over years and across various market cycles. This wealth of information gives predictive models the depth they need to analyze trends and behaviors effectively.
One of the standout advantages of historical data is its objectivity. It removes personal bias from the equation, ensuring that analyses are neutral and reproducible. When datasets and methodologies are openly shared, others can replicate the results, which strengthens confidence in the reliability of predictive models.
Historical data also allows for thorough backtesting. By simulating strategies across bull, bear, and sideways markets, traders can spot potential weaknesses before deploying real capital. This kind of testing is invaluable for refining strategies.
Additionally, historical data supports sophisticated quantitative techniques like ARIMA, LSTM neural networks, and XGBoost, which are designed to identify intricate patterns. For instance, studies have shown that ARIMA models can achieve up to 99.94% accuracy for 7-day Bitcoin forecasts. However, accuracy tends to drop to 95.84% for 30-day predictions, highlighting the challenges of longer-term forecasting [2].
Drawbacks and Challenges
While historical data is a powerful tool, it’s not without its limitations. Market regime shifts - caused by regulatory changes, technological advancements, or institutional activity - can disrupt established patterns, making predictions less reliable during periods of transition.
Unpredictable events, such as exchange hacks, government bans, major partnership announcements, or global economic shocks, can render historical patterns irrelevant. These events often lead to sudden price swings, precisely when accurate predictions are most critical.
For newer or low-volume cryptocurrencies, limited data availability is a significant challenge. A lack of historical records can lead to models overfitting small datasets, making them unreliable when applied to new or broader market conditions.
Another issue is the decreasing accuracy over time. As the prediction horizon extends, unforeseen factors increasingly come into play, reducing the reliability of forecasts.
Finally, there’s the risk of overfitting. When models become overly tailored to historical data, they may end up capturing noise rather than meaningful patterns. This often results in poor performance when markets deviate from past trends.
Comparison Table of Benefits and Drawbacks
| Benefits | Drawbacks |
|---|---|
| Extensive data for major cryptocurrencies | Market regime shifts can disrupt predictions |
| Objective analysis eliminates personal bias | Unpredictable events can invalidate patterns |
| Reproducible results for validation | Limited data for newer or low-volume assets |
| Enables thorough backtesting | Accuracy declines over longer timeframes |
| Supports advanced modeling techniques | Overfitting risks with complex models |
The secret to effective crypto prediction lies in balancing these trade-offs. Advanced platforms like StockioAI are tackling these challenges by integrating historical data with real-time analytics. By processing over 60 data points per second, StockioAI adapts quickly to changing market conditions [1].
Savvy traders know that combining historical insights with real-time data and adaptive models is key to navigating the volatile crypto landscape. This blend ensures that predictions stay relevant, even as markets evolve.
Improving Predictions with AI Platforms: StockioAI in Focus
While understanding the strengths and limitations of historical data is essential, the real breakthrough lies in how advanced AI platforms transform this information into actionable insights for trading. StockioAI stands out as a platform that combines historical data analysis with real-time market intelligence, offering traders a robust tool for cryptocurrency prediction and risk management.
How StockioAI Uses Historical Data for Predictions
StockioAI takes historical cryptocurrency data to the next level by leveraging it to train advanced AI models. The platform processes an extensive range of historical price data - open, high, low, close, and volume metrics - across multiple timeframes. This data forms the backbone for training Long Short-Term Memory (LSTM) and Gated Recurrent Unit (GRU) networks, both of which specialize in uncovering complex patterns in time series data [3][4].
But StockioAI doesn’t stop at surface-level analysis. Its deep learning models dive into subtle correlations and nonlinear relationships within historical data - connections that traditional statistical methods often overlook. What sets StockioAI apart is its continuous learning process, where models are regularly updated with fresh market data. This ensures the platform adapts to evolving market conditions rather than relying on outdated patterns.
To validate its predictive models, StockioAI employs rigorous backtesting methodologies. By splitting historical data into training and testing sets, the platform evaluates performance using metrics like mean squared error (MSE), mean absolute error (MAE), and mean absolute percentage error (MAPE) [3]. This thorough validation ensures reliable and actionable predictions.
Main StockioAI Features for Traders
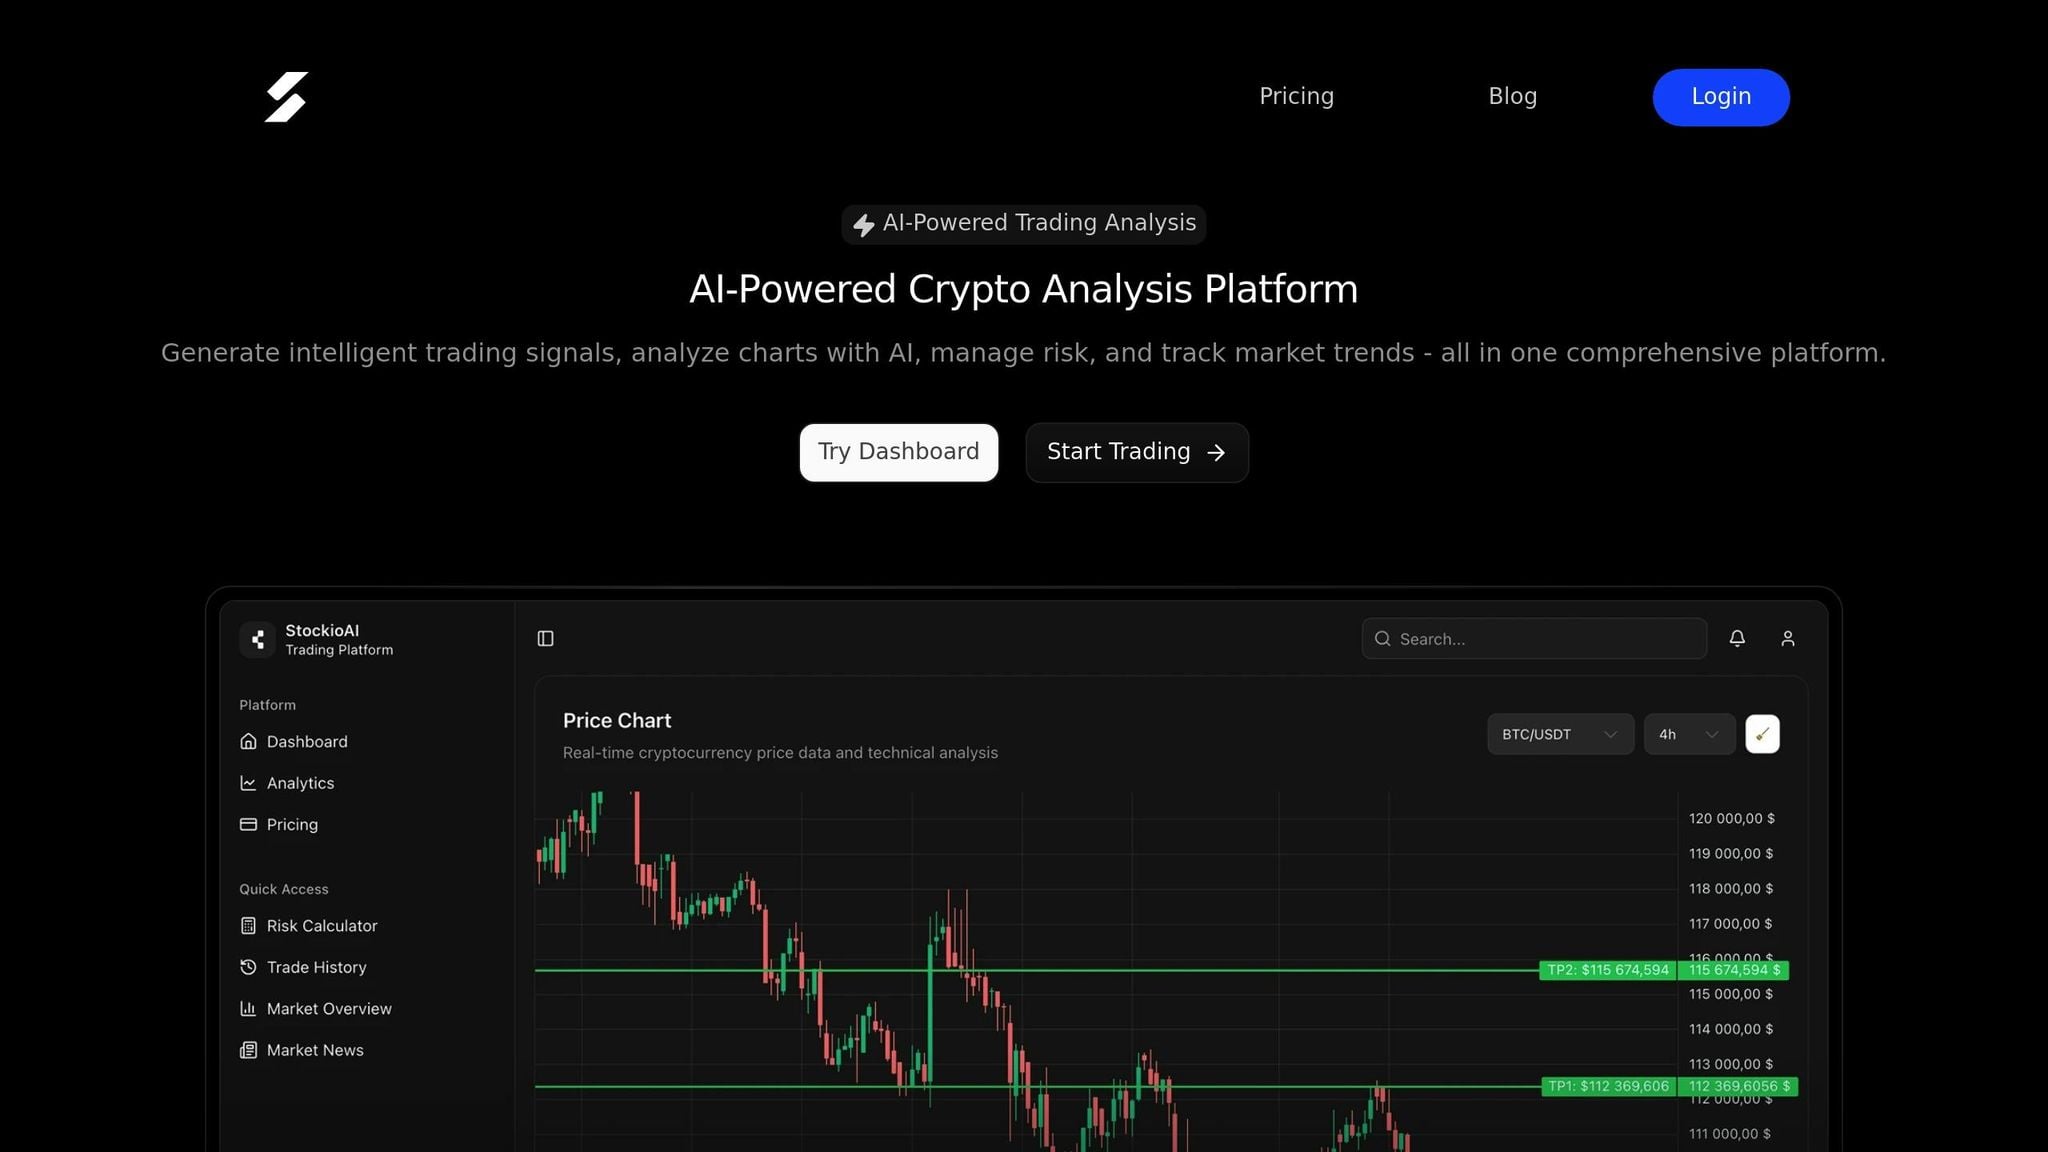
StockioAI builds on its predictive models with a suite of trading tools designed around historical data analysis. The platform processes over 60 real-time data points every second, blending current market activity with historical patterns to deliver detailed trading insights [1].
One standout feature is its AI-powered BUY, SELL, and HOLD signals. These signals are crafted using pattern recognition algorithms that analyze historical price trends, volume changes, support and resistance levels, and market sentiment data. Each signal includes clear entry points, stop-loss levels, profit targets, and confidence scores, all grounded in historical precedent [1].
The platform also integrates interactive chart analysis, combining TradingView charts with AI-generated trading levels and technical indicators. This feature overlays support and resistance zones, trend lines, and other elements derived from historical price action, helping traders visualize key market movements.
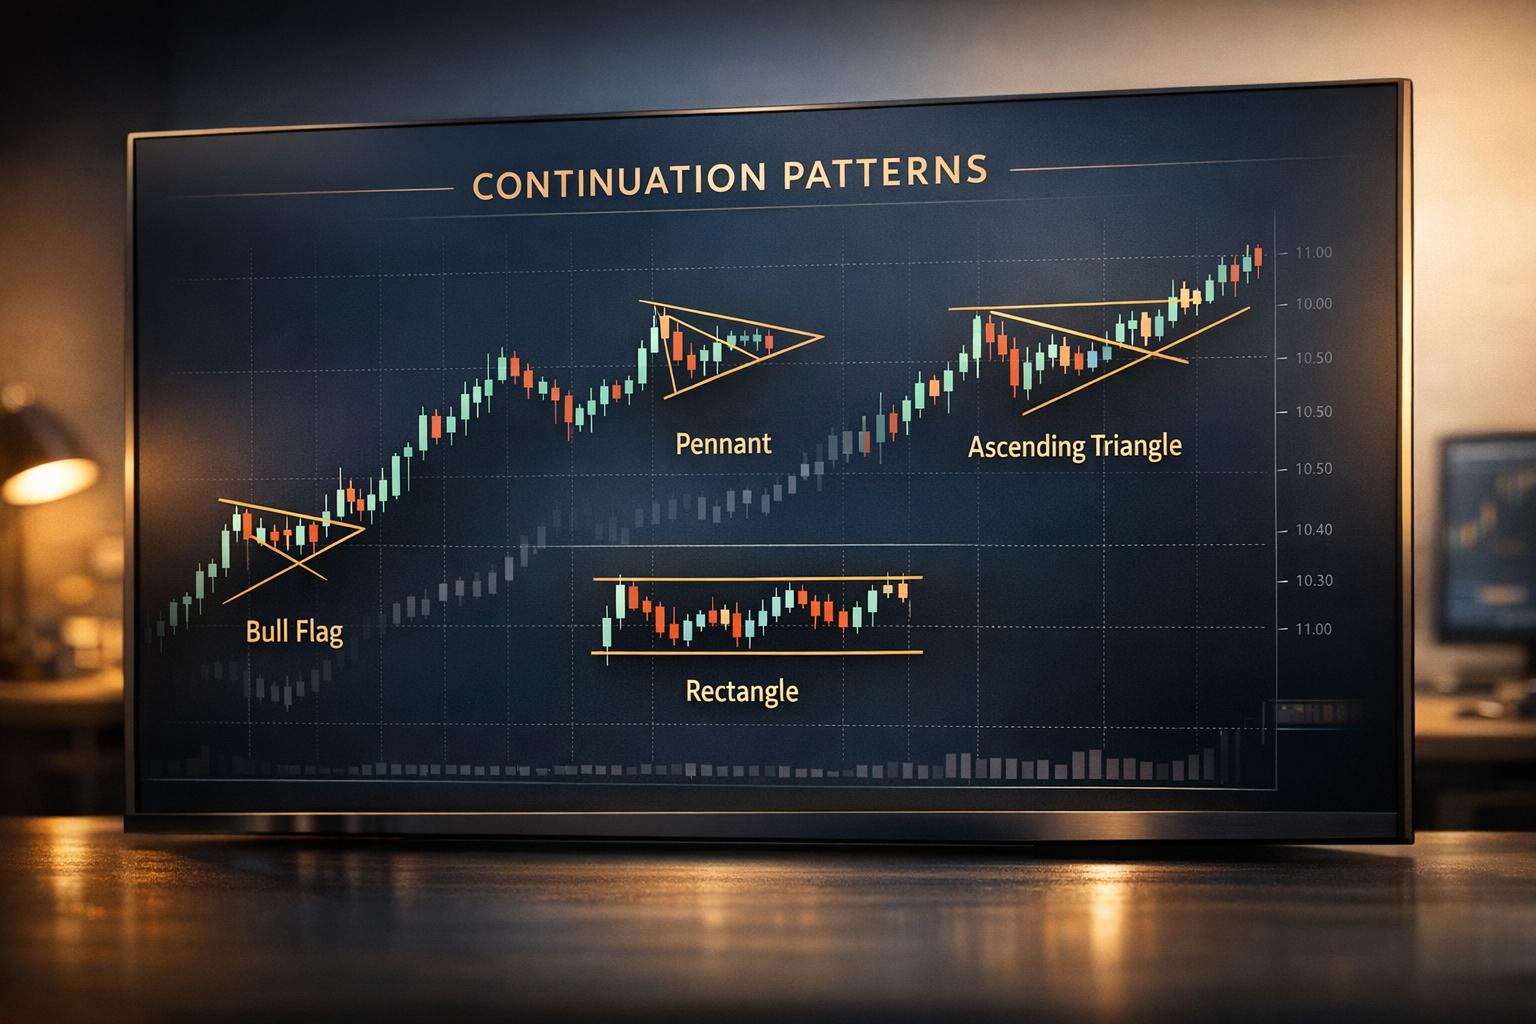
Another key tool is the AI pattern recognition system, which automatically identifies recurring chart formations like head-and-shoulders, double bottoms, and triangles. By comparing current market structures to historical examples, the system highlights opportunities that might otherwise go unnoticed.
Risk calculators play a crucial role by analyzing historical volatility and past drawdown statistics. These tools estimate potential losses and recommend optimal position sizes, giving traders a clearer picture of potential risks before executing trades. They also calculate value-at-risk metrics and scenario-based outcomes using historical data.
The platform’s multi-timeframe analysis adds another layer of depth, examining patterns across timeframes ranging from minutes to months. This enables traders to align short-term strategies with longer-term trends, all informed by historical market behavior.
Benefits of Using StockioAI for Predictive Analysis
Traders who rely on StockioAI’s historical data-driven approach gain several advantages that address the challenges of using historical data effectively. Its deep learning models outperform traditional methods, delivering better results than conventional ARIMA models [3][4].
Faster decision-making is another major benefit. StockioAI analyzes historical patterns in real time, providing instant alerts when current conditions align with historically profitable setups. This speed is invaluable in the fast-paced cryptocurrency market, where opportunities can vanish within minutes.
The platform’s scenario-based risk management tools allow traders to simulate various outcomes using historical market data. By examining how similar situations unfolded in the past, traders can better prepare for different scenarios and fine-tune their position sizes accordingly.
StockioAI also helps traders overcome emotional biases. Its data-driven recommendations eliminate the influence of emotions like FOMO (fear of missing out) or panic selling. Every signal is grounded in historical analysis and mathematical models, ensuring objectivity in decision-making.
The multi-timeframe insights feature allows traders to see the bigger picture while identifying short-term opportunities. By analyzing how current conditions fit into broader historical trends, traders can make more informed decisions.
Finally, StockioAI’s continuous model updates ensure its predictions remain relevant. As new historical data becomes available, the platform retrains its AI models, keeping them effective even as cryptocurrency markets evolve and introduce new dynamics.
Conclusion: The Value of Historical Data in Crypto Predictions
Main Points Recap
Historical data plays a critical role in cryptocurrency trading, acting as the backbone for making accurate market predictions. Traditional forecasting methods, such as ARIMA, have demonstrated impressive results - achieving a precision rate of 99.94% for seven-day Bitcoin predictions. Meanwhile, advanced deep learning models like GRU and LSTM push the boundaries further, delivering outstanding performance with MAPE values as low as 0.035 and R² values of 0.94[2][3][5].
AI platforms have revolutionized how historical data is utilized, turning raw numbers into actionable trading strategies. For instance, StockioAI processes more than 60 real-time data points every second, merging past trends with live market conditions to generate precise BUY, SELL, and HOLD signals. In actual trading, the platform boasts a 75% win rate and a profit factor of 2.95[1].
Experienced traders recognize that historical data is most effective for short-term forecasting, where market patterns are more stable and predictable. By using platforms that continuously update their models with the latest data, traders can adapt to ever-changing market dynamics while still relying on the insights provided by historical trends.
Final Thoughts on Using Historical Data
The real power of historical data lies in its ability to bring a structured, data-driven approach to navigating the volatile crypto market. In an environment that changes by the second, tools capable of analyzing massive amounts of historical data with speed and accuracy are essential. Manual methods simply can't compete with the precision and speed of AI platforms in uncovering subtle market patterns.
Platforms like StockioAI are making this kind of advanced analysis accessible to traders of all skill levels. By integrating historical data with AI-driven tools, traders can gain a significant edge - spotting opportunities, managing risks, and ensuring consistent performance. As the crypto market continues to evolve, those who embrace these data-based strategies will be better equipped to succeed.
FAQs
How does StockioAI improve prediction accuracy compared to traditional models like ARIMA?
StockioAI taps into advanced AI algorithms to sift through massive amounts of historical cryptocurrency data, uncovering patterns and trends that traditional models like ARIMA might miss. Unlike ARIMA, which depends on linear assumptions and time-series data, StockioAI employs machine learning to handle the unpredictable, non-linear nature of the crypto market.
With this technology, StockioAI delivers real-time, precise BUY, SELL, and HOLD signals, alongside cutting-edge technical analysis tools. It also integrates AI-driven insights with interactive features such as chart analysis and risk calculators, giving traders the tools they need to navigate the ever-shifting crypto landscape with confidence.
What challenges come with using historical data for long-term cryptocurrency predictions, and how does StockioAI help overcome them?
Predicting long-term cryptocurrency trends is no walk in the park. The market’s notorious volatility, shifting trends, and the ripple effects of external factors like regulatory updates or major global events make it tough to depend solely on historical data for accurate forecasts.
That’s where StockioAI steps in. By blending historical data with real-time market analytics, this platform uses AI-powered tools to tackle these challenges head-on. With features like pattern recognition, technical analysis, and risk management tools, StockioAI equips traders with actionable insights. This dynamic approach allows users to stay ahead of evolving market conditions and make smarter, more balanced decisions for the long haul.
How can traders avoid overfitting when using historical data for cryptocurrency predictions?
Overfitting happens when a prediction model becomes too tailored to past data, making it struggle to adapt to new market conditions. To minimize this risk, traders can take a few practical steps:
-
Incorporate diverse datasets: Go beyond just price history. Include data like trading volumes, market sentiment, and external factors to create a more balanced model.
-
Simplify the model: Avoid using overly complex algorithms that might pick up on random noise instead of genuine trends.
-
Test with fresh data: Evaluate your model using unseen or out-of-sample data to confirm it works beyond the training set.
Platforms like StockioAI can be a valuable ally, offering tools for real-time analysis and AI-driven insights, helping traders steer clear of overfitted models.