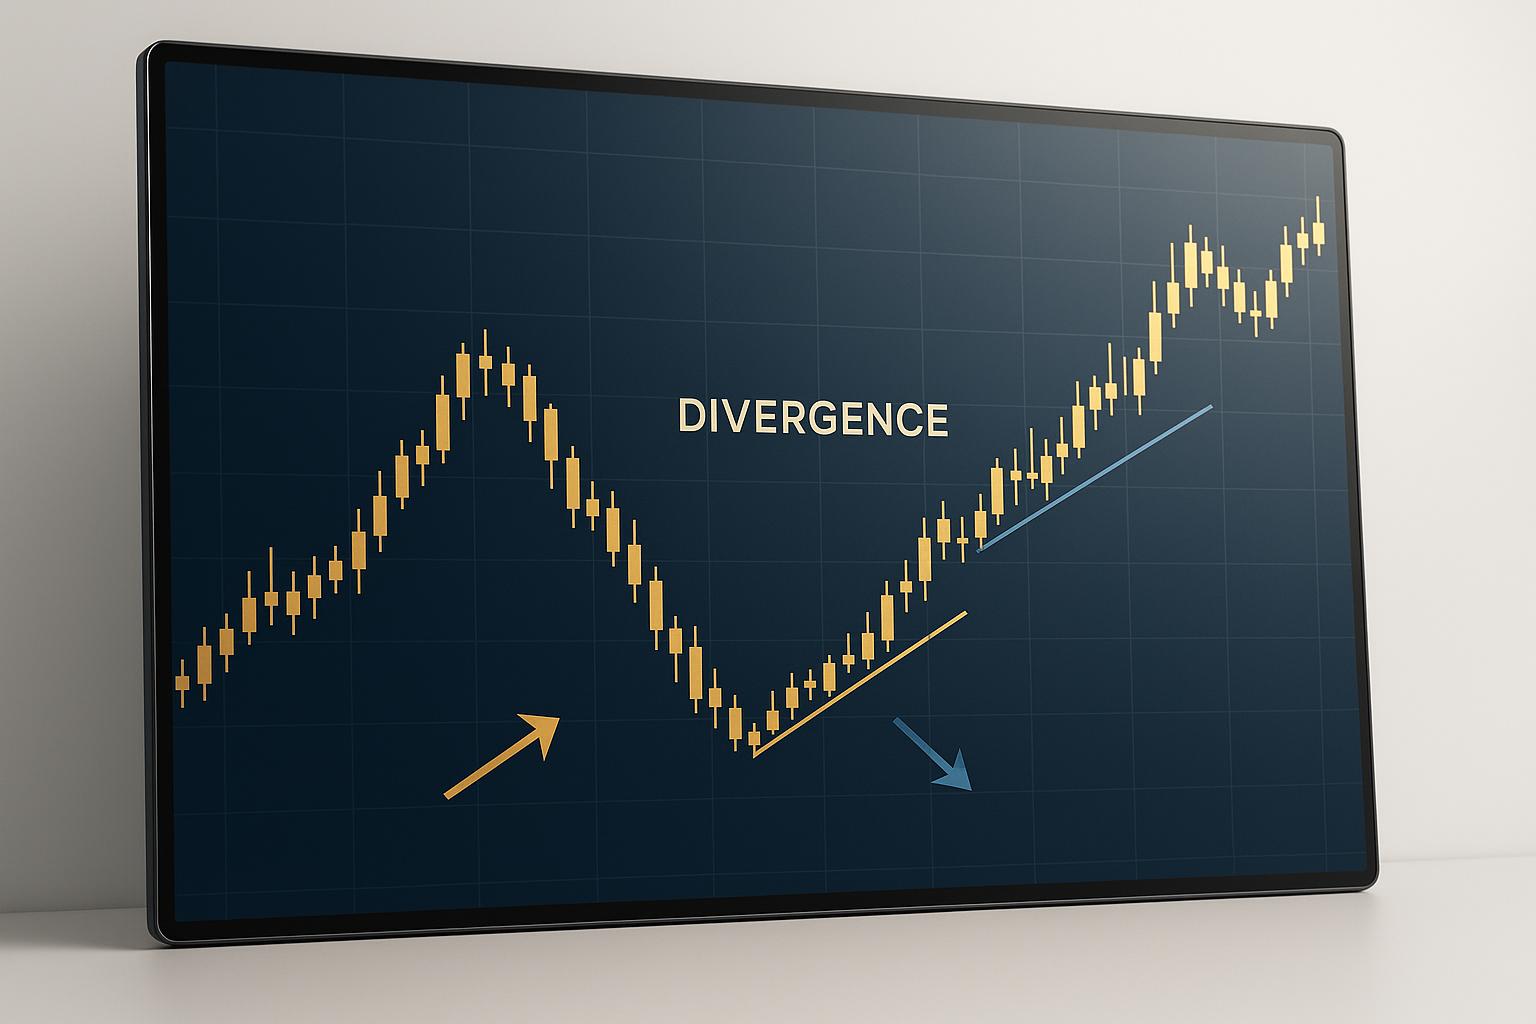
Divergence is a key concept in crypto trading that helps identify potential trend reversals or continuations by comparing price movements with technical indicators like RSI, MACD, or Stochastic Oscillator. This guide explains how divergence works, its types, and how traders can use it effectively.
-
What is Divergence?
Divergence happens when price moves differently from an indicator, signaling a possible market shift.- Example: If Bitcoin's price hits a higher high but RSI forms a lower high, it signals bearish divergence.
-
Types of Divergence:
- Regular Divergence: Indicates trend reversals.
- Bullish: Price forms lower lows, indicator shows higher lows.
- Bearish: Price forms higher highs, indicator shows lower highs.
- Hidden Divergence: Suggests trend continuation.
- Bullish: Price forms higher lows, indicator shows lower lows.
- Bearish: Price forms lower highs, indicator shows higher highs.
- Regular Divergence: Indicates trend reversals.
-
Key Indicators for Divergence:
- RSI: Best for momentum shifts in ranging markets.
- MACD: Combines trend and momentum analysis for trending markets.
- Stochastic Oscillator: Detects overbought/oversold levels, useful in volatile conditions.
-
- Spot divergence by comparing price and indicator trends.
- Confirm signals using volume, candlestick patterns, or support/resistance levels.
- Manage risk with stop-loss orders and proper position sizing.
- Use higher timeframes for more reliable signals.
-
AI Tools for Divergence:
Platforms like StockioAI automate divergence detection by analyzing real-time data and providing actionable signals, improving accuracy and efficiency for traders.
This guide equips you with the basics of divergence trading, helping you anticipate market movements and make informed decisions.
Hidden Divergence Trading - POWERFUL Trade Strategy - (Stocks Crypto and Forex Trading Strategy)
Types of Divergence in Cryptocurrency Markets
Cryptocurrency trading often involves spotting patterns that signal potential market movements. Two key patterns traders rely on are regular divergence, which hints at possible trend reversals, and hidden divergence, which reinforces ongoing trends. Let’s break these down.
Regular (Classic) Divergence
Regular divergence is your go-to signal for spotting potential trend reversals before they become obvious to the market. It happens when a cryptocurrency’s price and a technical indicator (like RSI or MACD) move in opposite directions, signaling that momentum is shifting.
-
Bullish regular divergence shows up in downtrends. It occurs when the price makes a lower low, but the indicator forms a higher low. This suggests selling pressure is weakening, and buyers might soon take control.
For instance, imagine a cryptocurrency drops from $50 to $45, then to $42, while its RSI creates higher lows. This mismatch signals that the downtrend is running out of steam, potentially paving the way for an upward reversal.
-
Bearish regular divergence appears during uptrends. Here, the price forms a higher high, but the indicator makes a lower high. This warns that buying momentum is fading, even as prices hit new peaks.
Picture Ethereum climbing from $2,000 to $2,200, pulling back briefly, and then rallying to $2,300. If the MACD shows a lower peak on the second rally, it’s a sign of bearish regular divergence. This indicates the uptrend is weakening, and a downward reversal might be on the horizon.
The beauty of regular divergence lies in its ability to highlight major tops and bottoms in the volatile crypto market. Spotting these points early can lead to big opportunities. However, keep in mind that these signals aren’t foolproof. Always pair them with other tools for confirmation.
Now, let’s look at hidden divergence, which offers a completely different perspective.
Hidden Divergence
Unlike regular divergence, hidden divergence is all about confirming trend continuation. This makes it a favorite for traders looking to ride the momentum of an existing trend or add to their current positions.
-
Hidden bullish divergence supports ongoing uptrends. It occurs when the price forms a higher low (a sign of trend strength) while the indicator makes a lower low. This suggests that even temporary dips in the indicator don’t undermine the overall bullish momentum.
For example, if Bitcoin pulls back to $55,000 and then $56,000, forming higher lows, while the Stochastic Oscillator registers lower lows, hidden bullish divergence confirms the uptrend. Traders can use this as a signal to hold or increase their long positions.
-
Hidden bearish divergence strengthens downtrends. It happens when the price creates a lower high (indicating trend strength) while the indicator makes a higher high. This shows that any upticks in the indicator are temporary, and the bearish trend is likely to persist.
Imagine a cryptocurrency in a downtrend, with prices hitting lower highs at $80 and $75. If the RSI rises higher during the second rally, it’s a case of hidden bearish divergence, confirming the downtrend’s continuation.
| Divergence Type | Price Pattern | Indicator Pattern | Signal | Best Use Case |
|---|---|---|---|---|
| Regular Bullish | Lower Low | Higher Low | Trend Reversal (Up) | Spotting bottoms in downtrends |
| Regular Bearish | Higher High | Lower High | Trend Reversal (Down) | Spotting tops in uptrends |
| Hidden Bullish | Higher Low | Lower Low | Trend Continuation (Up) | Confirming strength in uptrends |
| Hidden Bearish | Lower High | Higher High | Trend Continuation (Down) | Confirming strength in downtrends |
Hidden divergence is particularly useful for position and swing traders. It reassures traders that pullbacks are temporary, allowing them to confidently hold or add to their positions.
Understanding the difference between regular and hidden divergence is essential. Regular divergence signals a potential trend change, while hidden divergence confirms the current trend’s strength. Mixing these up can lead to costly mistakes. By recognizing these patterns, you can make smarter decisions about when to enter, exit, or adjust your cryptocurrency trades.
Key Indicators for Spotting Divergence
Technical indicators are invaluable for identifying mismatches between price movements and momentum in the fast-paced crypto market. While price charts show where a cryptocurrency has been, momentum indicators can hint at where it might be heading. Among the most reliable tools for spotting divergence are RSI, MACD, and the Stochastic Oscillator - each suited to different market conditions.
Using RSI for Divergence Detection
The Relative Strength Index (RSI) is a straightforward tool that ranges from 0 to 100, making it an accessible choice for spotting divergence. By measuring how quickly and significantly a cryptocurrency's price has changed, RSI highlights momentum strength.
When RSI diverges from price action, it provides critical clues about momentum shifts that might not be obvious from price charts alone. For instance, regular bullish divergence occurs when a crypto’s price hits lower lows, but RSI forms higher lows - indicating that selling pressure is weakening even as prices continue to drop[4]. Conversely, regular bearish divergence happens when prices climb to higher highs, but RSI shows lower highs, signaling that buying momentum is fading despite rising prices[2].
One of RSI’s key strengths is its bounded scale, where readings above 70 suggest overbought conditions and below 30 indicate oversold levels. This makes it especially effective in ranging markets where cryptocurrencies oscillate between support and resistance. Its sensitivity often allows it to signal divergence earlier than other tools. However, this same trait can lead to more false signals during volatile periods - a common scenario in crypto trading. RSI shines when used to detect momentum shifts within established trends rather than chasing every minor price fluctuation.
Next, let’s dive into MACD, which adds a layer of trend analysis to momentum detection.
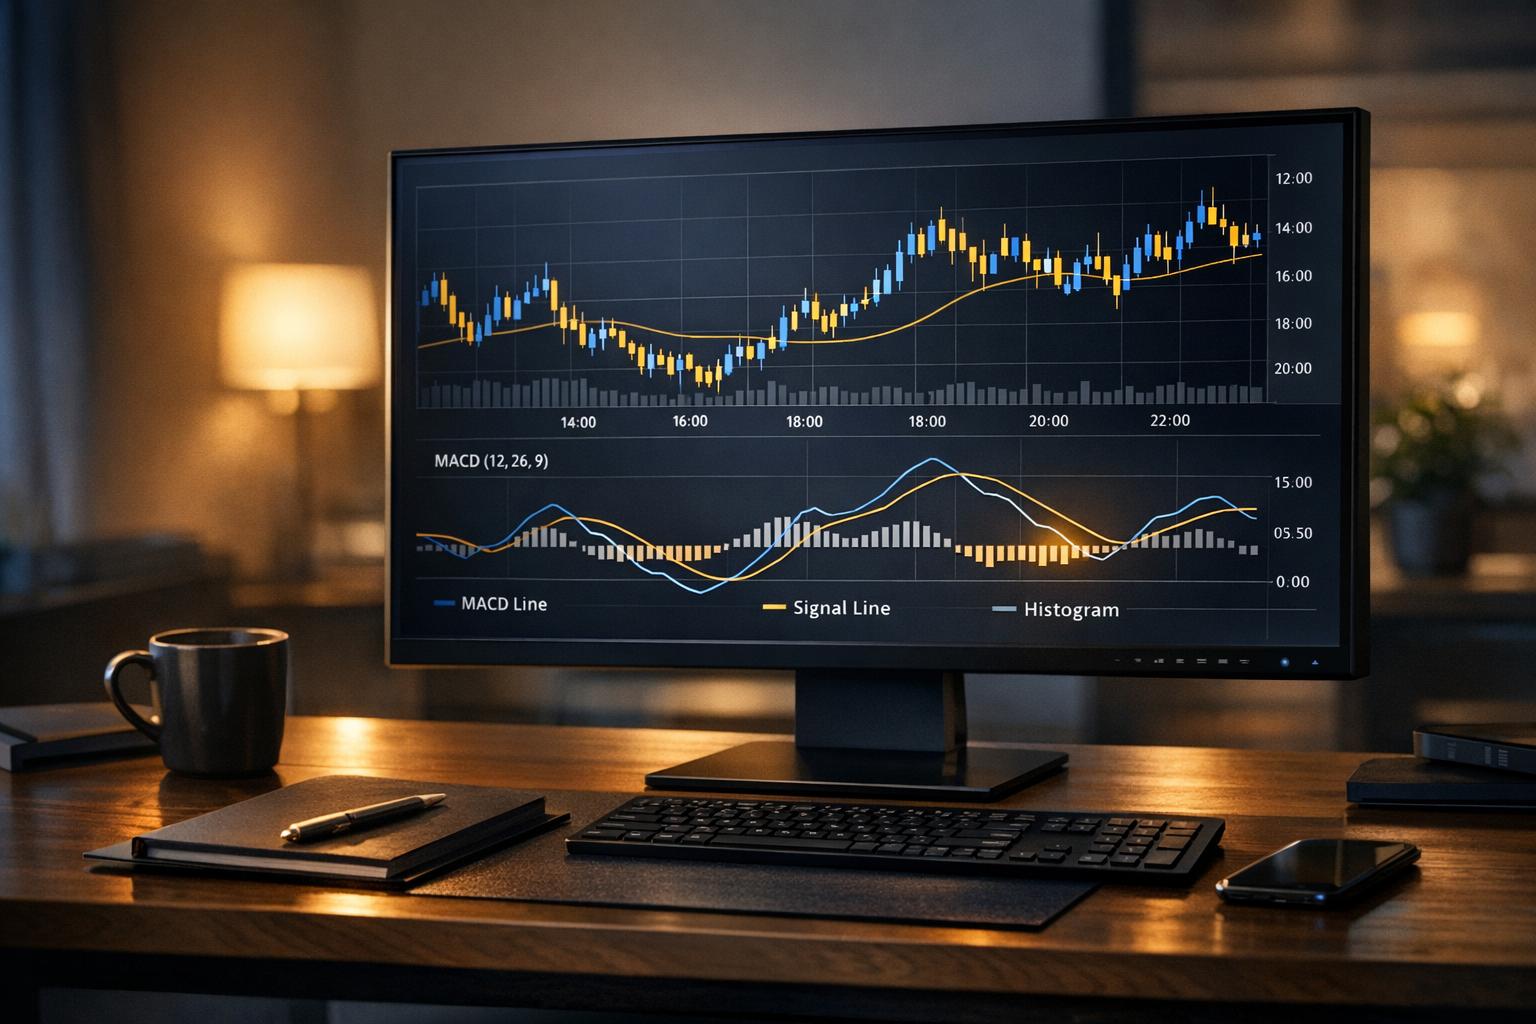
MACD and Divergence Analysis
Building on RSI’s momentum insights, the Moving Average Convergence Divergence (MACD) combines trend and momentum analysis, offering a broader perspective. MACD calculates the difference between two exponential moving averages (typically 12-period and 26-period) and compares it against a signal line.
MACD makes it easier to spot divergences visually. For example, if Bitcoin reaches a new high but the MACD histogram fails to do the same, it’s a clear sign of weakening momentum[2]. The histogram highlights these divergences effectively, with peaks and valleys that don’t align with price movements.
Unlike RSI, MACD has no upper or lower limits, allowing it to capture a full range of momentum changes during volatile market conditions. This makes it particularly useful for identifying sustained trends and detecting when a trend is gaining or losing strength. MACD’s visual elements - like the histogram and signal line crossovers - make it more accessible for traders who are newer to technical analysis. The combination of multiple components helps confirm divergence signals, reducing the chances of false readings.
Stochastic Oscillator in Divergence Trading
The Stochastic Oscillator measures where a cryptocurrency’s closing price stands relative to its recent price range, generating values between 0 and 100. It uses two lines: %K (the main line) and %D (the signal line), which work together to identify overbought and oversold conditions.
This indicator is particularly sensitive to price extremes, with values above 80 signaling overbought conditions and below 20 indicating oversold levels. For example, if Bitcoin reaches a new high but the Stochastic Oscillator forms a lower high, this divergence suggests weakening momentum[2]. Its sensitivity makes it an excellent tool for detecting early divergence signals - especially valuable in the crypto market’s high-volatility environment.
The Stochastic Oscillator is most effective when paired with other indicators for confirmation. It performs well in ranging markets where cryptocurrencies move between established support and resistance levels, complementing trend-following tools like MACD.
| Indicator | Best Market Conditions | Primary Strength | Signal Timing | Reliability |
|---|---|---|---|---|
| RSI | Ranging markets | Momentum exhaustion detection | Early signals | High in sideways markets |
| MACD | Trending markets | Trend and momentum analysis | Moderate timing | High in trending conditions |
| Stochastic | Ranging markets | Overbought/oversold detection | Very early signals | High with confirmation |
Experienced crypto traders rarely rely on just one indicator. RSI excels in highlighting momentum exhaustion, MACD is better suited for trending markets, and the Stochastic Oscillator offers the earliest signals in ranging conditions[2]. Together, these indicators form the foundation of any effective divergence trading strategy.
Platforms like StockioAI take this a step further by integrating these techniques with AI-powered pattern recognition. These systems can analyze divergence trends across multiple timeframes simultaneously - something almost impossible to achieve manually[7]. By leveraging multiple AI models to cross-verify signals, they help minimize false positives in divergence detection[7].
These tools and techniques are essential building blocks for crafting successful divergence trading strategies.
Divergence Trading Strategies
A successful divergence trading strategy hinges on recognizing patterns, confirming signals, and managing trades with discipline. When these elements come together, they create a structured approach that can improve trading outcomes.
How to Spot Divergence on Charts
To identify divergence, start by selecting an indicator like RSI, MACD, or the Stochastic Oscillator and place it below your price chart. Compare the trends of the price and the indicator.
For bullish divergence, look for instances where the cryptocurrency's price forms a lower low, but the indicator shows a higher low at the same points. This suggests that selling pressure is weakening. On the flip side, bearish divergence occurs when the price makes higher highs, but the indicator forms lower highs, signaling that buying momentum is losing strength even as prices rise.
To avoid subjective interpretations, visually confirm divergence by drawing trendlines. Connect the relevant highs or lows on both the price chart and the indicator chart. These trendlines should clearly show opposing directions, making the divergence pattern easy to spot.
Timeframe selection plays a crucial role. Divergence on higher timeframes, like daily charts, tends to be more reliable than on shorter intervals like 15-minute charts. While higher timeframes may yield fewer opportunities, they filter out market noise and provide stronger signals.
Once you've identified divergence, take an extra step to confirm its reliability using additional techniques.
Confirming Divergence Signals
To strengthen the validity of divergence signals, look for supporting factors such as rising trading volume, reversal candlestick patterns (e.g., hammers, doji, or engulfing candles), and breaks of key support or resistance levels. Signals are especially compelling when they align with major technical levels or trendline breaks.
AI-powered tools, such as StockioAI, can simplify this process. Platforms like these analyze over 60 real-time data points every second[1], incorporating technical indicators, volume trends, support levels, market sentiment, and even social media activity. This comprehensive analysis generates precise signals with detailed reasoning, clear entry points, and confidence scores.
Once you’ve confirmed divergence signals, the next step is to manage your trades effectively.
Trade Management: Entry, Stop-Loss, and Take-Profit
After confirming a signal, wait for price action to break key levels before entering a trade. For bullish setups, this might mean entering after the price breaks above short-term resistance. For bearish setups, enter when the price breaks below short-term support. Alternatively, some traders rely on momentum indicators crossing key thresholds, such as RSI moving above 30 for bullish signals or below 70 for bearish signals.
To manage risk, set stop-loss orders just beyond the swing high or low that formed the divergence. For bullish divergence, place the stop below the low; for bearish divergence, set it above the high. This approach limits potential losses while giving trades room to develop.
For take-profit targets, aim for logical technical levels like previous support or resistance zones, Fibonacci retracement levels, or a favorable risk-reward ratio (e.g., 2:1 or 3:1). To protect your account during losing streaks, cap your risk at 1–2% of your account per trade.
Platforms like StockioAI can further streamline trade management. For example, their Starter plan ($16/month) offers 30 AI-generated trading signals per month, while the Professional plan ($79/month) provides 150 signals. Each signal includes detailed guidance on entry points, stop-loss orders, and take-profit levels[6].
| Trade Management Component | Best Practice | Example |
|---|---|---|
| Entry | Wait for confirmation beyond divergence | Enter long when price breaks above resistance after bullish divergence |
| Stop-Loss | Place beyond the divergence swing point | Set stop $50 below the low that created bullish divergence |
| Take-Profit | Target 2:1 or 3:1 risk-reward ratio | If risking $100, target $200–300 profit |
| Position Size | Risk 1–2% of account per trade | On a $10,000 account, risk a maximum of $100–200 |
Risk Management and Common Mistakes to Avoid
Navigating the volatile cryptocurrency market requires a solid risk management strategy, especially when trading divergence signals. Without proper safeguards, even the most accurate signals can lead to significant losses.
Stop-Loss Orders and Position Sizing
Once you've identified a divergence signal, protecting your capital becomes the next critical step. One way to do this is by setting stop-loss orders just beyond the divergence swing. For bullish signals, place the stop-loss below the swing low; for bearish signals, position it above the swing high.
For instance, if Bitcoin is trading at $40,000 and the swing low is $39,500, a stop-loss at $39,450 would provide a safety net.
Position sizing is another key element of risk management. Limit your risk to no more than 1–2% of your total account per trade. For example, with a $10,000 account and a stop-loss distance of $550, your trade size should be roughly 0.18–0.36 Bitcoin.
Tools like StockioAI's Risk Calculator can simplify this process by automating calculations for position sizes, stop-loss levels, and leverage settings, making it easier to manage trades effectively[1].
How to Avoid False Signals
In the crypto market, false divergence signals are a common challenge, especially in highly volatile or strongly trending conditions. The solution? Always confirm your signals with additional evidence before entering a trade.
Avoid relying solely on divergence. Instead, look for confirmation through factors such as volume spikes, reversal candlestick patterns, or breaks in key support and resistance levels. In strong trends, divergence signals often fail because the market's momentum remains intact.
AI-driven platforms can help filter out low-quality signals. For instance, StockioAI analyzes over 60 real-time data points every second, including technical indicators, volume trends, market sentiment, order book activity, large trader movements, and even social media chatter. This comprehensive analysis generates trading signals with detailed reasoning and confidence scores, helping you steer clear of setups with low success rates[1].
Multi-Timeframe Analysis for Better Results
In addition to stop-loss placement and position sizing, using multi-timeframe analysis can significantly enhance your trading decisions. A divergence pattern that appears on both a 1-hour and a daily chart holds more credibility than one that only shows up on a 15-minute chart.
Start by examining higher timeframes, such as daily or 4-hour charts, to understand the broader market trend. Then, zoom in to shorter timeframes to fine-tune your entry points. If the signals on different timeframes conflict - like a bearish divergence on the daily chart but bullish momentum on the 4-hour chart - it's often best to proceed cautiously or skip the trade entirely.
StockioAI's Multi-timeframe Insights feature simplifies this process by automatically analyzing market conditions across various timeframes, helping you make more informed decisions[1].
For example, imagine spotting bearish divergence on Ethereum's daily chart while its weekly chart still shows bullish momentum. This discrepancy suggests that the bearish signal might lead to a short-term pullback rather than a major reversal. Adjusting your profit targets and expectations based on this insight can save you from unnecessary risks.
Using StockioAI for Divergence Analysis
StockioAI takes the traditional method of divergence detection and gives it a modern, automated edge, making trading decisions faster and more precise. Unlike manual divergence detection - which demands constant chart-watching and advanced technical skills - StockioAI uses AI to streamline the process, delivering valuable insights in seconds.
AI-Powered Divergence Detection
StockioAI’s machine learning algorithms are designed to continuously monitor cryptocurrency markets, processing over 60 real-time data points every second to spot divergence patterns[5]. It identifies both regular and hidden divergences using popular indicators like RSI, MACD, and the Stochastic Oscillator.
For instance, when Bitcoin’s price drops to a lower low, but the RSI indicator shows a higher low, StockioAI flags this as a regular bullish divergence. The platform doesn’t stop there - it generates a Buy signal with detailed reasoning, highlights the divergence on interactive charts, and even suggests entry points, stop-loss levels, and take-profit targets based on historical support and resistance zones[2][4].
What sets StockioAI apart is its ability to go beyond basic indicator analysis. It incorporates price action, volume trends, market sentiment from social media, order book data, and even whale activity to validate divergence signals. This comprehensive approach ensures weak signals - those that might seem valid at first glance - are filtered out before traders are alerted.
These insights are seamlessly integrated into StockioAI’s broader suite of trading tools.
Trading Tools for Divergence Strategies
StockioAI equips traders with an impressive toolkit to enhance divergence trading strategies. Its interactive chart analysis works effortlessly with TradingView, letting traders overlay AI-detected divergence patterns with their own technical analysis[5][6].
The platform also includes a risk calculator to help manage volatile markets. For example, if you’re trading a bullish divergence on Ethereum, the calculator determines the ideal position size based on your account balance and a risk tolerance of 1–2% per trade - taking the guesswork out of risk management[5][6].
Another standout feature is multi-timeframe analysis, which examines divergence patterns across 1-hour, 4-hour, and daily charts. A divergence identified on both the daily and 4-hour charts carries far more weight than one limited to a 15-minute timeframe[5][6].
To ensure traders don’t miss opportunities, StockioAI offers a real-time alert system. It sends instant notifications for high-probability setups, complete with confidence scores and detailed trade explanations.
These tools, combined with advanced analytics, make StockioAI a powerful ally in refining divergence strategies.
Improving Accuracy with StockioAI
Divergence analysis in crypto markets can be tricky, often leading to false signals in strong trends. StockioAI tackles this challenge by blending technical indicators with market sentiment analysis, offering a fuller understanding of market conditions[5].
The platform’s AI engine synthesizes data from multiple sources, applying advanced pattern recognition and integrating real-time analytics like news sentiment and institutional activity. This approach allows StockioAI to achieve an impressive 75% win rate with a profit factor of 2.95, far surpassing traditional manual methods[1].
"StockioAI revolutionized my trading strategy. The AI insights helped me achieve consistent 18% monthly returns." - Jordan Martinez, Quantitative Trader[1]
To boost accuracy further, StockioAI uses a confidence scoring system that evaluates signals based on factors like pattern strength, volume, and market context. The AI continuously learns from past performance, adapting to changing market conditions and improving its predictions over time[5].
For those deeply invested in divergence strategies, StockioAI also offers API access. This feature allows traders to integrate AI-generated signals with custom trading bots, enabling automated execution of high-confidence trades while they focus on broader strategy and portfolio management[5].
Conclusion: Mastering Divergence in Crypto Trading
Understanding divergence analysis can transform the way traders navigate the cryptocurrency markets. It’s not just another technical tool - it provides a window into market psychology, revealing momentum shifts that often precede major price changes.
Here’s the key: regular divergence signals potential reversals, while hidden divergence confirms trend continuation. Grasping this distinction is crucial for avoiding costly mistakes, like exiting profitable trades too early or going against the market’s flow. This knowledge forms the backbone of effective trading strategies.
But theory alone isn’t enough. Risk management plays a pivotal role when trading divergence signals. Many successful traders stick to risking just 1–2% per trade, placing stop-losses slightly beyond the swing points that define the divergence. Combining this disciplined risk approach with well-planned position sizing and realistic take-profit levels - often aligned with previous support or resistance - can turn divergence into a reliable edge.
Another critical factor is using multiple timeframes and confirmation signals. Divergence patterns on higher timeframes, like 4-hour or daily charts, carry more weight than those on shorter timeframes. Adding confirmations from other indicators or tools significantly reduces the chances of being misled by false signals, improving overall success rates[3][4].
For those looking to go a step further, AI-powered platforms like StockioAI are setting new standards. By processing over 60 real-time data points per second and boasting a 75% win rate with a 2.95 profit factor, these tools enhance traditional divergence strategies with cutting-edge insights[1].
"StockioAI revolutionized my trading strategy. The AI insights helped me achieve consistent 18% monthly returns." - Jordan Martinez, Quantitative Trader[1]
To sustain long-term success, continuous improvement and adaptation are non-negotiable. Regularly tracking your win rates, refining risk-reward ratios, and analyzing divergence accuracy can lead to a 5–15% boost in profitability over time.
Divergence analysis becomes even more effective when paired with other elements like volume, support/resistance levels, and market sentiment. Traders who master this integration - whether through manual methods or AI-driven platforms - set themselves up to uncover the lucrative opportunities that divergence patterns can reveal in the ever-evolving cryptocurrency markets.
FAQs
What are the best ways for traders to confirm divergence signals and avoid false positives in crypto trading?
To reduce the chances of false positives when spotting divergence signals in crypto trading, it's wise to combine various tools and strategies. Start by leveraging trusted indicators like the Relative Strength Index (RSI), Moving Average Convergence Divergence (MACD), or Stochastic Oscillator. These can help you pinpoint instances where price movements and indicator trends significantly diverge.
Once you've identified a potential signal, strengthen its validity by looking for confluence with other technical elements. This could include support and resistance levels, trendlines, or specific candlestick patterns. Such cross-checking adds another layer of confidence to your analysis. Also, keep the timeframe in mind - signals on higher timeframes tend to be more dependable than those on lower ones.
For extra support, consider incorporating AI-powered tools like StockioAI. These platforms can provide real-time analysis, recognize patterns, and deliver actionable trading signals, giving you a clearer picture of market conditions. No matter how strong a signal appears, always back it up with solid risk management practices to safeguard your investments.
How can AI tools like StockioAI improve divergence analysis in crypto trading?
AI tools, such as StockioAI, bring a new level of efficiency to divergence analysis by delivering real-time trading signals and advanced technical analysis. Thanks to AI-driven pattern recognition, these tools enable traders to spot critical market trends and potential reversals with improved accuracy.
By handling complex calculations automatically and providing clear, actionable insights, StockioAI streamlines the decision-making process. This makes it simpler for traders to refine their strategies and act with confidence in dynamic market conditions.
Why should traders analyze divergence patterns across multiple timeframes in cryptocurrency markets?
Analyzing divergence patterns across various timeframes is essential for gaining a deeper understanding of market trends and spotting potential reversals. Each timeframe offers its own perspective - shorter timeframes capture quick price movements, while longer timeframes provide a clearer picture of the overall trend.
When traders combine insights from multiple timeframes, they can filter out false signals more effectively and refine their strategies. This method offers a balanced view, helping traders make smarter decisions in the ever-changing and unpredictable cryptocurrency market.