AI is transforming how traders understand market volatility. By analyzing massive data streams from cryptocurrencies, stocks, bonds, and commodities, AI tools identify patterns and relationships that traditional methods often miss. Platforms like StockioAI process real-time data - technical indicators, social media sentiment, and more - to deliver actionable trading signals with a 75% win rate.
Key methods include machine learning for price trends, NLP for sentiment analysis, and hybrid models combining multiple approaches. These systems predict volatility across markets, helping traders manage risk and seize opportunities. For example, AI can detect how a Bitcoin crash might influence tech stocks, offering early warnings for portfolio adjustments.
Quick Takeaways:
-
AI Tools: Real-time insights, dynamic risk measures, and trading signals.
-
Techniques: LSTM models for trends, NLP for sentiment, hybrid models for accuracy.
-
Applications: Predicting volatility, risk management, and cross-market analysis.
AI-powered platforms like StockioAI make advanced analytics accessible to both individual traders and institutions, helping them navigate complex, interconnected markets efficiently.
Volatility Based Stock Trading with AI and Statistics #finance #trading #investing
Key AI Methods for Volatility Assessment
AI leverages advanced techniques to analyze massive datasets, uncover patterns, and forecast volatility across various asset classes. Let’s take a closer look at the roles of machine learning, natural language processing (NLP), and hybrid approaches in making these predictions.
Machine Learning Models for Volatility Prediction
Machine learning models, particularly Long Short-Term Memory (LSTM) networks, are highly effective at analyzing sequential price data. These networks excel in spotting time series patterns, making them ideal for detecting subtle shifts in market volatility that traditional models might miss [2][6]. Transformer architectures take this a step further by processing vast datasets to uncover complex temporal relationships. Meanwhile, Graph Neural Networks (GNNs) focus on connections between markets, predicting how volatility in one asset class could influence another [5].
A notable example of machine learning in action comes from Deutsche Börse's "Intraday Volatility Forecast" project, launched in 2015. By training machine learning models on high-frequency data, the project provided 30-minute forecasts for major European indices. These forecasts outperformed traditional methods, particularly in out-of-sample testing [6].
Models such as LSTMs, transformers, Support Vector Machines (SVMs), and Artificial Neural Networks (ANNs) have proven adept at capturing temporal patterns and technical signals, significantly improving the accuracy of volatility predictions [2][4].
Natural Language Processing for Sentiment Analysis
AI doesn’t just rely on numbers - it also taps into textual data to assess market sentiment. Natural Language Processing (NLP) tools analyze unstructured text from sources like news articles, social media posts, earnings calls, and regulatory filings to gauge public sentiment. This is crucial because shifts in sentiment often precede volatility spikes, offering a predictive edge before changes are reflected in price data. Popular data sources for NLP include Twitter feeds, financial news outlets, and company press releases.
Models like BERT and its finance-specific variant, FinBERT, are widely used for extracting sentiment, helping AI systems interpret the tone and potential market impact of written content [2][4]. Research shows that sentiment analysis often predicts volatility movements more accurately than price data alone. For instance, social media activity around a company can signal increased return volatility, while coverage from trusted financial outlets can reduce uncertainty and stabilize markets [3].
Hybrid AI Approaches for Better Forecasting
Combining multiple AI methods often yields the most reliable volatility forecasts. Hybrid models integrate techniques like LSTM networks for price trend analysis with NLP-based sentiment modules that process real-time news and social media data. Ensemble methods then merge these outputs, allowing the system to dynamically adjust forecasts based on both quantitative trends and qualitative shifts in sentiment [2].
For example, StockioAI employs hybrid modeling to integrate diverse real-time data streams, delivering actionable trading signals [1]. These combined approaches outperform single-method models by a significant margin. Neural networks, in particular, have shown statistically and economically meaningful improvements in out-of-sample forecasts compared to linear regressions and tree-based models [6]. Hybrid models are especially valuable in cross-market volatility analysis, where their ability to process diverse data streams offers early warnings for potential volatility spikes across entire portfolios.
| Model Type | Data Sources | Key Strengths | Best Use Cases |
|---|---|---|---|
| LSTM/Neural Networks | Sequential price data | Detects temporal patterns, adapts quickly | Time series forecasting, trend analysis |
| NLP (BERT, FinBERT) | News, social media | Analyzes sentiment, provides real-time insights | Event-driven volatility, market psychology |
| Hybrid Models | Multi-source, multi-type | Combines strengths for higher accuracy | Cross-market analysis, risk assessment |
Data Integration and Feature Engineering for AI Models
For AI to effectively analyze cross-market volatility, it must transform diverse financial data into actionable insights. This process involves gathering data from numerous sources, cleaning it, and engineering features that help models detect volatility patterns across different markets.
Multi-Source Financial Data
AI models rely on a wide range of data sources, including cryptocurrency exchanges, stock markets, economic indicators, and sentiment data, to capture a complete picture of market conditions [2][5]. By integrating these varied datasets, models can uncover spillover effects between asset classes - connections that might go unnoticed in single-market analyses.
For instance, StockioAI processes over 60 real-time data points, such as technical indicators, volume trends, support and resistance levels, sentiment analysis, order book depth, and social media activity, to predict cross-market volatility [1]. This allows it to identify patterns like a Bitcoin crash influencing tech stocks.
To achieve this, robust APIs and synchronized data pipelines are essential. These systems pull data from sources like the NYSE, Coinbase, Federal Reserve economic releases, and social media platforms [5]. By combining real-time data from both traditional and cryptocurrency markets, AI models can analyze how macroeconomic events ripple through multiple asset classes simultaneously.
Alternative data sources have added new dimensions to volatility modeling. Examples include satellite imagery for predicting commodity price fluctuations, analysis of central bank communications for fixed-income markets, and social media sentiment for equity forecasting [5]. Studies reveal that high social media activity around a company often predicts increased return volatility, while attention from influential outlets like the Wall Street Journal tends to decrease it [3].
After integration, this diverse data undergoes feature engineering, refining it into precise inputs for volatility forecasting.
Feature Engineering for Volatility Analysis
Raw data alone isn’t enough - AI models need it transformed into features that enhance prediction accuracy. For example, market data can be turned into features like RSI (Relative Strength Index), MACD (Moving Average Convergence Divergence), Bollinger Bands, and realized volatility, which help models spot momentum shifts [2][6].
Deep learning models with attention mechanisms can dynamically prioritize the most important features, such as sudden surges in trading volume or negative sentiment in news feeds [2]. This adaptability is particularly crucial during periods of market stress, where certain signals may predict sharp volatility changes.
Research analyzing the top 100 most liquid S&P 500 stocks from July 2011 to June 2021 showed that neural networks significantly outperformed traditional models in forecasting volatility [6]. These improvements were observed across various timeframes, from 10 minutes to daily intervals, highlighting the value of carefully engineered features.
Another key feature for volatility prediction is cross-asset correlation metrics. These metrics help models understand how volatility in one market impacts others, which is critical for managing diversified portfolios [4]. For example, during financial crises, when correlations between assets often break down, these metrics can signal potential volatility spikes across interconnected markets.
Challenges in Data Integration
Integrating data from different markets isn’t without its hurdles. Each market operates under unique conditions - trading hours, liquidity levels, and regulatory frameworks - which complicates efforts to create a unified dataset [5]. For instance, U.S. stock markets run from 9:30 AM to 4:00 PM ET, while cryptocurrency markets operate 24/7. Aligning timestamps and normalizing liquidity are essential to avoid misleading signals.
Data quality and consistency add another layer of complexity. Aggregating diverse datasets requires rigorous validation, cleaning, and normalization processes to address missing values and standardize formats (e.g., USD, MM/DD/YYYY) [5]. Automated quality checks and anomaly detection algorithms are indispensable for maintaining data integrity across multiple streams.
Regulatory differences further complicate data integration. AI models must account for events like regulatory announcements, market halts, and varying reporting standards across asset classes [5]. For example, regulatory news in cryptocurrency markets can trigger sudden volatility spikes, unlike the more predictable responses in regulated stock markets. Feature engineering must incorporate event flags or regime indicators to handle such scenarios.
Other challenges include data latency and incomplete coverage. Delayed economic reports or gaps in social media sentiment data can hinder prediction accuracy [5]. Overcoming these issues requires continuous data monitoring and robust model validation to ensure reliable forecasts, even under diverse market conditions.
| Data Source Type | Examples | Key Challenges | Solutions |
|---|---|---|---|
| Market Data | NYSE, Coinbase, CME | Different trading hours, varying liquidity | Timestamp alignment, liquidity normalization |
| Economic Indicators | Fed releases, employment data | Data delays, irregular schedules | Nowcasting models, interpolation techniques |
| Sentiment Data | Twitter, news feeds | Noise, bias, relevance | NLP filtering, source weighting |
| Alternative Data | Satellite imagery, central bank communications | Quality variability, integration complexity | Automated validation, anomaly detection |
Comparing Volatility Across Financial Markets
This section dives into how volatility is standardized and compared across financial markets, building on the AI techniques covered earlier. By integrating and processing data from various sources, AI models can evaluate volatility across different asset classes. These comparisons rely on metrics that adjust for market differences, enabling traders to gauge relative risks. Metrics like historical, implied, Value at Risk (VaR), and realized volatility are key to this process. These methods stem from earlier steps in data integration and feature engineering, ensuring a thorough cross-market analysis.
Standardized Metrics for Volatility Comparison
AI systems rely on several metrics to make meaningful comparisons between markets. Here's a quick breakdown:
-
Historical Volatility: Measures price fluctuation over time by calculating the standard deviation of price changes, offering a retrospective view of market behavior.
-
Implied Volatility: Extracted from options prices, this provides a forward-looking estimate of market uncertainty.
-
Value at Risk (VaR): Quantifies the maximum expected loss over a specific period, helping traders understand potential downside risks.
-
Realized Volatility: Based on high-frequency intraday data, this captures actual price movements over short intervals.
Neural networks have proven to outperform traditional models in forecasting volatility across different timeframes, improving accuracy and reliability in risk evaluation[6].
Correlation Analysis and Spillover Effects
AI models, particularly graph neural networks, analyze how volatility spreads across interconnected markets. These systems represent financial networks as complex webs where volatility shocks can ripple through various channels[5]. For example, they can detect whether a spike in Bitcoin volatility precedes or follows movements in the S&P 500, offering actionable insights for portfolio risk management.
To quantify these relationships, systemic risk models use adjusted R-squared values from linear regressions, measuring how one asset's volatility correlates with overall market volatility[6]. These methods are essential for understanding cross-market dynamics and are summarized in the table below.
Comparison Table of Market Volatility
Different asset classes exhibit unique volatility patterns, which AI models must consider when making comparisons. The table below outlines typical volatility ranges, trading schedules, model performance, data needs, and primary drivers for various markets:
| Market Type | Typical Volatility (Annualized) | Trading Hours | AI Model Performance | Key Data Requirements | Primary Volatility Drivers |
|---|---|---|---|---|---|
| Cryptocurrencies | 60-100%+ | 24/7 | Hybrid models with NLP excel | Price, social media, on-chain data, news | Sentiment, regulatory changes, large trades |
| U.S. Equities | 15-25% | 9:30 AM - 4:00 PM ET | Neural networks, LSTM excel | High-frequency price, volume, earnings data | Earnings, economic reports, sector trends |
| Government Bonds | 5-10% | Varies by market | Time series models perform well | Interest rates, inflation, central bank data | Interest rate adjustments, monetary policy |
| Commodities | 20-40% | Varies by commodity | Machine learning with supply/demand factors | Price, inventory levels, geopolitical events | Supply disruptions, demand changes, weather |
Neural networks trained on pooled data across multiple asset classes suggest that shared patterns may exist, regardless of market type[6]. However, the table also highlights key differences. For instance, cryptocurrency markets demand continuous monitoring due to their 24/7 trading, while traditional markets operate on fixed schedules. This affects sampling frequencies - cryptocurrency models benefit from real-time data, while traditional markets typically use 10-30 minute intervals for intraday forecasts[6].
AI models must also adapt to regime shifts, which vary by asset class. Cryptocurrencies often experience rapid changes triggered by events like regulatory announcements or major adoption news. In contrast, traditional markets typically shift more gradually, influenced by economic cycles or earnings reports[5].
Practical Applications of AI-Powered Tools
Advanced methods for analyzing market volatility are now enabling traders to make informed decisions in real time. Platforms like StockioAI bridge the gap between complex mathematical models and practical trading strategies, offering tools that help traders navigate unpredictable markets with greater confidence. By applying these analyses in real time, StockioAI supports decisive and timely trading actions.
StockioAI's Real-Time Volatility Analytics
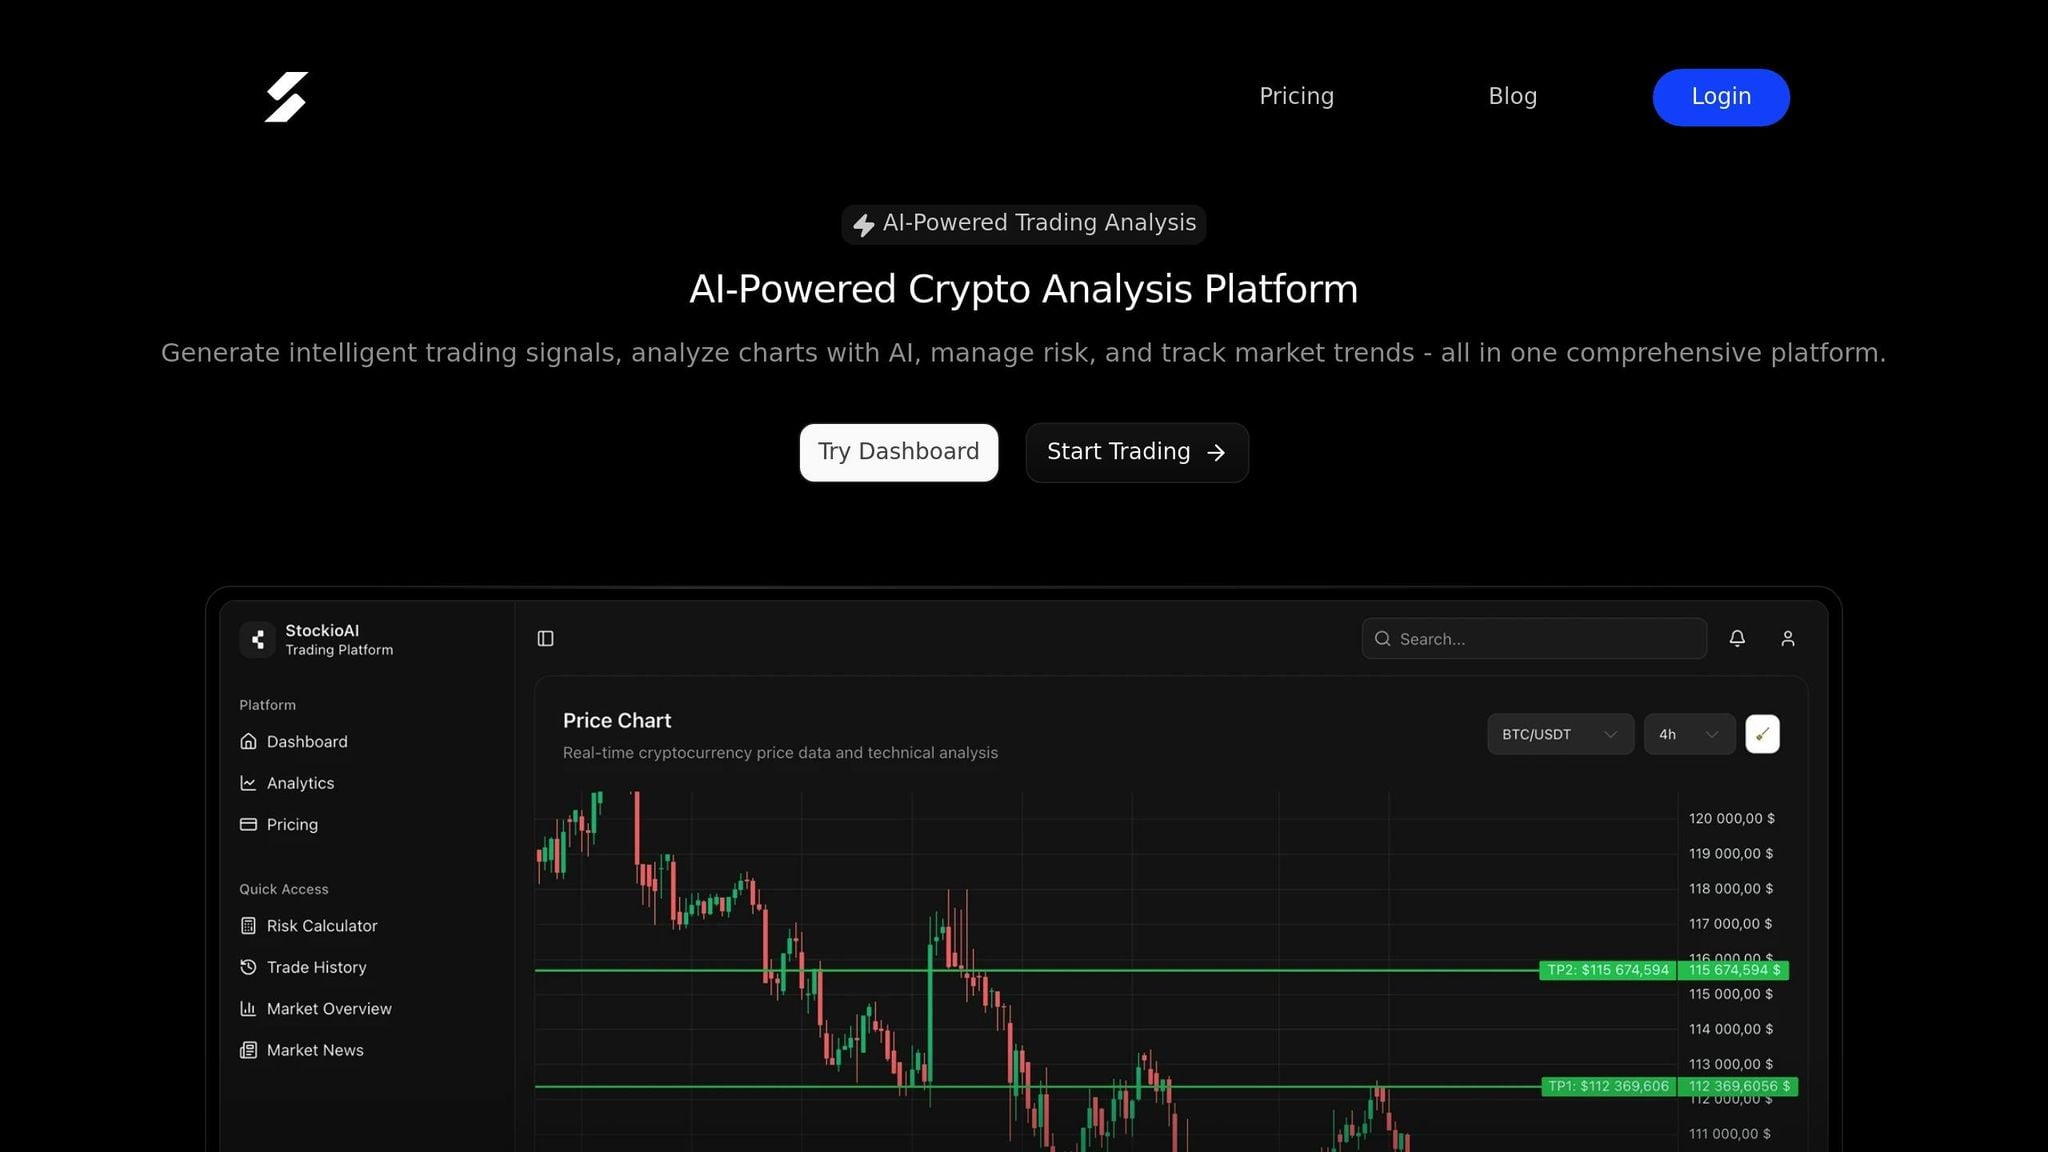
StockioAI transforms raw market data into actionable trading insights by analyzing over 60 real-time data points. These include technical indicators, volume trends, sentiment analysis, order book depth, whale activity, and social media dynamics. The result? Precise trading signals - BUY, SELL, or HOLD - accompanied by detailed reasoning, entry points, stop-loss levels, profit targets, and confidence scores.
For instance, when Bitcoin undergoes sudden price fluctuations, StockioAI's algorithms can detect similar emerging patterns in altcoins. This allows traders to swiftly adjust their positions - either to seize opportunities or to mitigate risks. The platform's real-time detection ensures users can respond effectively to rapid market shifts.
StockioAI also integrates seamlessly with TradingView, offering a multi-timeframe view of market volatility. Its 7-tier priority system evaluates factors such as market structure, volume, liquidity, RSI and MACD indicators, EMA ribbon analysis, SMA context, and price momentum. This hierarchy ensures that signals from higher timeframes take precedence over those from lower ones, leading to more reliable assessments.
Additionally, StockioAI classifies market regimes - identifying whether conditions are trending, ranging, volatile, or quiet. This classification directly influences how volatility signals are interpreted. During periods of extreme market activity, the system adjusts its risk recommendations and position sizing using a conflict resolution matrix that accounts for 15 distinct market scenarios.
Risk Management and Strategy Development
StockioAI’s real-time signals go beyond trend identification - they actively support smarter risk management. Its dynamic risk calculators analyze live volatility data to recommend optimal position sizes and adjust risk exposure. For example, during heightened volatility, the platform might suggest reducing exposure or hedging with less volatile assets.
By leveraging multi-timeframe analysis, the platform ensures that risk strategies remain consistent across different trading horizons. This approach acknowledges that short-term and long-term volatility patterns can vary significantly, providing traders with a more comprehensive risk management framework.
Benefits for Individual and Institutional Traders
StockioAI’s analytics cater to both individual traders and large institutions, offering tiered solutions tailored to their needs. For retail traders, the platform simplifies advanced volatility analysis with intuitive dashboards and clear trading signals.
-
Free Plan: Includes two AI trading signals per month and basic market insights, ideal for beginners.
-
Starter Plan ($49/month): Offers 30 AI trading signals monthly, along with essential technical analysis tools - perfect for those just starting with AI-assisted trading.
-
Professional Plan ($99/month): Provides 300 AI trading signals per month, pattern recognition, priority support, portfolio tracking, and API access for advanced traders.
-
Enterprise Plan ($199/month): Designed for institutions, this plan includes all professional features plus multi-user access, dedicated account management, custom AI training, and white-label solutions.
For institutional users, StockioAI delivers more than just trading signals. Its portfolio-level analytics, regulatory compliance reporting, and integration capabilities enhance existing trading infrastructures. APIs allow seamless incorporation of AI-driven insights into proprietary systems, improving risk management without requiring a complete system overhaul.
Research backs the effectiveness of AI in volatility forecasting. A study covering the top 100 most liquid S&P 500 stocks from July 2011 to June 2021 found that neural networks consistently surpassed traditional methods like linear regressions and tree-based models in predicting intraday volatility. With continuous model recalibration, StockioAI ensures its tools remain accurate and aligned with evolving market conditions.
For institutional traders, the benefits extend beyond individual signals to include comprehensive analytics, streamlined compliance reporting, and scalable integration options. These features make it easier for large-scale operations to adopt AI-driven insights without disrupting existing workflows.
Conclusion
AI has completely transformed the way traders analyze and respond to market volatility. By processing massive amounts of real-time data, AI systems have replaced manual analysis with faster, more precise insights. Neural networks, in particular, have proven to outperform older methods when it comes to forecasting intraday volatility[6].
The advantages of AI - speed and accuracy - are especially clear in today’s interconnected financial landscape. These systems can monitor cryptocurrency exchanges, traditional stock markets, and even alternative data sources like social media sentiment all at once. This ability to spot patterns that human analysts might overlook adds a new layer of predictive power to volatility forecasting. For example, StockioAI has demonstrated a 75% win rate, underscoring the potential of these technologies[1].
For traders dealing with the complexities of modern markets, AI-driven platforms offer tools that were once exclusive to large institutions. StockioAI’s integrated approach stands out by providing timely trading signals and advanced risk management through multi-timeframe analysis.
AI’s benefits go beyond just generating signals. It also plays a crucial role in adaptive risk management. Advanced tools can automatically adjust position sizes and stop-loss levels based on real-time market conditions, helping traders protect their capital during volatile periods. This ensures consistent risk adjustments, even as market dynamics shift.
Looking ahead, AI is poised to become even more powerful. Innovations like graph neural networks and the integration of alternative data sources are expected to push volatility forecasting to new heights[5]. As these technologies evolve, platforms like StockioAI will continue to refine their tools, offering deeper insights and stronger risk management features. The result? Individual traders now have access to analytics that were once the domain of institutional players, leveling the playing field in financial markets.
FAQs
How does AI enhance the accuracy of predicting market volatility?
AI has transformed the way market volatility is predicted by processing enormous amounts of data from various financial markets - including cryptocurrencies and traditional assets - in real time. With advanced algorithms at its core, AI uncovers patterns, trends, and connections that might slip past conventional analysis.
By tapping into machine learning and pattern recognition, AI tools adjust to shifting market dynamics, offering sharper insights. Take StockioAI, for instance. This platform employs AI-powered analytics to provide real-time trading signals and risk management tools, equipping traders with the information they need to navigate unpredictable markets more confidently.
What are the advantages of using hybrid AI models to analyze volatility across financial markets?
Hybrid AI models bring together the best of various machine learning techniques to offer sharper and more detailed analysis of cross-market volatility. These models help traders grasp the interplay between traditional assets, like stocks and bonds, and newer markets, such as cryptocurrencies.
Here’s why they stand out:
-
Sharper predictions: By combining diverse data sources and algorithms, hybrid models cut down on errors and improve forecasting accuracy.
-
Broader market understanding: They decode intricate patterns across multiple markets, uncovering trends and connections that might otherwise go unnoticed.
-
Up-to-the-minute insights: Tools like StockioAI provide real-time market data and trading signals, empowering traders to make quicker, well-informed decisions.
Leveraging hybrid AI models equips traders with the tools they need to tackle market volatility with clarity and precision.
How does StockioAI maintain high-quality and consistent data when analyzing financial markets?
StockioAI prioritizes data quality and consistency by using cutting-edge AI algorithms to handle and standardize a wide range of financial data. These tools efficiently clean, structure, and align information from various markets, whether it's cryptocurrencies or traditional assets, ensuring the data remains accurate and dependable.
With real-time monitoring and updates, StockioAI significantly reduces discrepancies, offering traders reliable insights they can trust. This ensures users have the information they need to make informed decisions based on solid market analysis.