AI-driven chart analysis tools are transforming how traders approach technical analysis. Platforms like StockioAI, TrendSpider, Trade Ideas, and Tickeron automate trend detection, support/resistance mapping, and risk management, saving time while improving accuracy. These tools cater specifically to U.S. traders by integrating with NYSE and NASDAQ, displaying data in USD, and aligning with Eastern Time. Key highlights include:
-
StockioAI: Combines real-time data processing (60+ points/second) with AI-driven trend detection and risk calculators. Ideal for stock and crypto traders ($79.99/month).
-
TrendSpider: Automates trendline analysis and support/resistance mapping with multi-timeframe overlays. Best for swing traders ($99/month).
-
Trade Ideas: Focuses on day trading with its "Holly" AI engine, delivering real-time equity signals ($89/month).
-
Tickeron: Offers affordable AI-driven pattern recognition and risk tools, starting at $60/year.
These platforms streamline decision-making by providing actionable insights, reducing the need for manual analysis, and supporting diverse trading styles. Whether you're a day trader or a swing trader, there's a solution tailored to your needs.
1. StockioAI
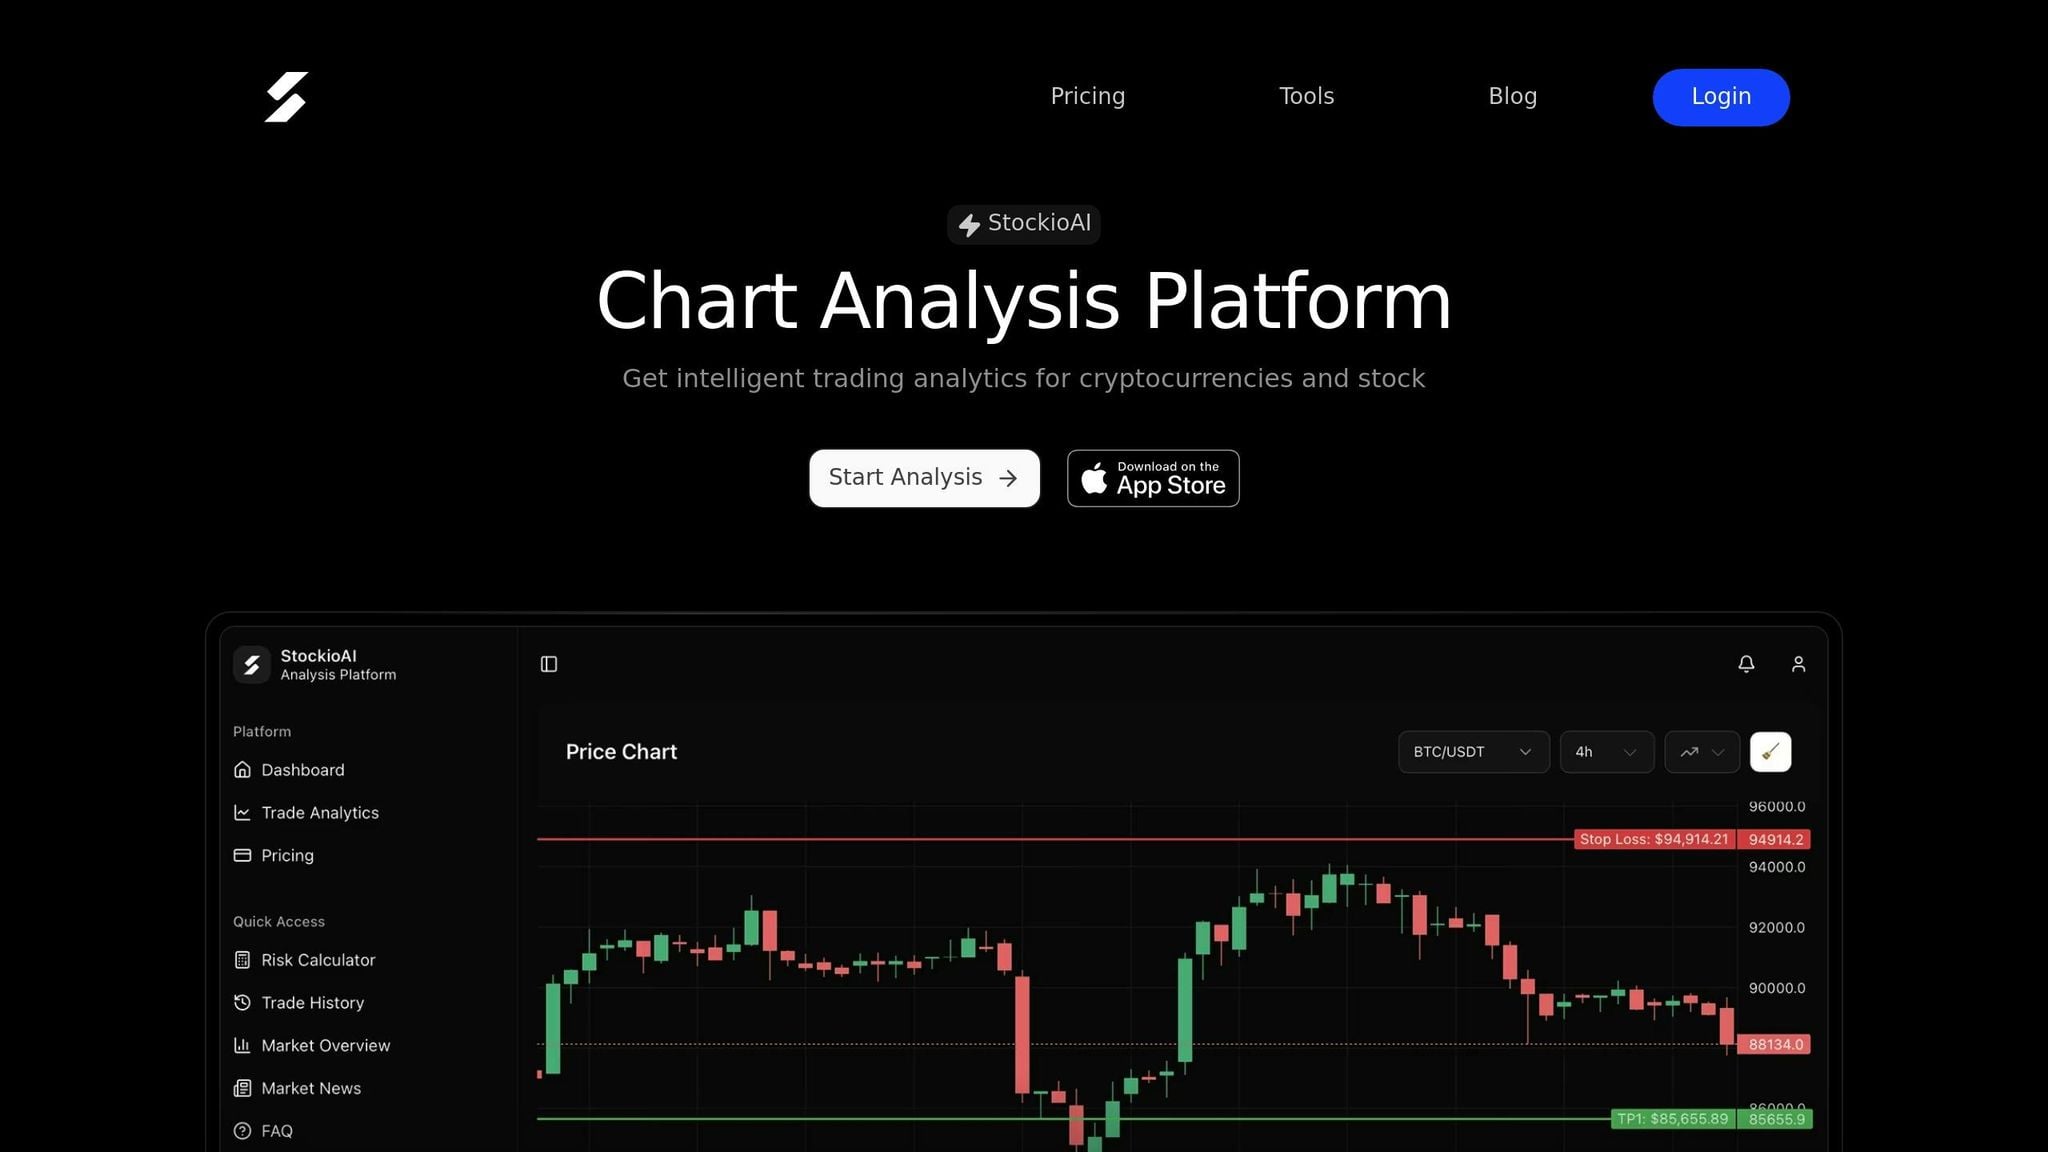
Trend Detection
StockioAI uses its lightning-fast data processing to pinpoint both short-term momentum changes and longer-term trends in stocks and cryptocurrencies [1]. It combines technical indicators like moving averages, RSI, MACD, and volume profiles with machine learning models trained on historical data to classify different market conditions [2].
For U.S. traders juggling multiple positions during NYSE and NASDAQ trading hours, this speed delivers real-time Buy, Sell, and Hold signals. These signals are displayed as color-coded markers and trend lines directly on candlestick charts. Short-term signals focus on intraday and multi-hour movements, while long-term trend detection relies on daily and weekly time frames. This approach cuts through market noise, offering clearer insights for swing and position trades.
"StockioAI revolutionized my trading strategy. The AI insights helped me achieve consistent 18% monthly returns." – Jordan Martinez, Quantitative Trader [1]
In addition to identifying trends, StockioAI integrates these insights into detailed support and resistance mapping for enhanced trading decisions.
Support/Resistance Mapping
StockioAI takes the guesswork out of support and resistance mapping by combining statistical clustering with AI-driven pattern detection. It analyzes swing highs and lows, consolidation zones, and areas with heavy trading volume to automatically draw horizontal levels, trend lines, and supply/demand zones. This eliminates the subjectivity of manual charting, providing traders with a repeatable framework for determining entry, exit, and stop-loss points.
By aligning trade signals with these mapped levels, StockioAI helps traders fine-tune their strategies. For instance, a Buy signal near a well-defined support level allows for tighter stop-loss placement, while a Sell signal at resistance can signal an opportunity to scale out or lock in profits.
Risk Management
StockioAI includes built-in risk calculators to determine optimal position sizes. These calculators consider account equity, dollar risk per trade, and stop-loss distances. Using ATR-based stop distances, the tool adjusts for recent market volatility and enforces minimum reward-to-risk ratios, keeping risk exposure between 0.5% and 2% per trade.
The platform also goes beyond single-chart analysis by scanning multiple tickers and sectors. This broader view helps U.S. traders identify correlated trends and potential concentration risks, offering insights for diversifying across domestic equities, cryptocurrencies, and other asset classes.
U.S. Market Relevance
StockioAI is specifically designed for U.S. traders, supporting major exchanges like the NYSE and NASDAQ with data and signals synced to Eastern Time (ET). All values are displayed in U.S. dollars ($), and dates follow the MM/DD/YYYY format, ensuring compatibility with brokerage platforms and tax documents. Premium users gain access to daily automated stock analysis for high-volume names like AAPL, META, GOOGL, TSLA, NVDA, and AMZN. Additionally, crypto analysis for BTC, ETH, SOL, and XRP is updated every four hours, ensuring timely insights for traders.
How to Analyze Charts using AI ?
2. Other AI Chart Analysis Platforms
While StockioAI sets a high bar, several other platforms bring unique AI-driven tools to the table, offering traders alternative ways to approach chart analysis.
Trend Detection
TrendSpider simplifies trendline analysis by automating the process and overlaying multiple timeframes. Using machine learning, it identifies trendlines across U.S. stocks, eliminating the need for manual charting. Its Raindrop charts uniquely combine price and volume data, helping traders identify momentum shifts during intraday trading sessions.
Trade Ideas employs its "Holly" AI engine to simulate trades nightly and deliver real-time signals for U.S. equities. This system pinpoints high-probability setups by analyzing pattern-driven trends across major U.S. stock exchanges.
Tickeron specializes in pattern recognition, offering AI-powered probability forecasts. Its stock screener identifies classic chart formations like head-and-shoulders, channels, and triangles. It also backtests these patterns, reporting win rates near 70% on indices such as the SPY, and provides visual probability cones to predict price paths.
Together, these platforms showcase a wide array of trend detection methods, expanding the horizons of AI chart analysis.
Support and Resistance Mapping
TrendSpider automates the identification of over 150 candlestick patterns and highlights support and resistance zones using heat-mapped supply and demand areas. By layering multiple timeframes on a single chart, it identifies critical levels across both daily and hourly views. This approach reduces subjectivity and allows traders to backtest these levels for historical accuracy.
Tickeron also provides support and resistance insights through its predictive signals, while Trade Ideas incorporates charting tools that link directly to one-click trading. Both platforms connect with major U.S. brokers like Interactive Brokers and TD Ameritrade, enabling swift execution at key price levels.
Risk Management
Managing risk is a key feature across these platforms, much like StockioAI. TrendSpider includes built-in backtesting and strategy testing tools, enabling trades to be executed directly from chart signals. Its trading bots help optimize position sizing and stop-loss placement, using data-driven risk-reward ratios.
Tickeron offers risk calculators and trading bots, coupled with portfolio trackers that monitor daily signals and adjust stock exposure as needed. Trade Ideas provides real-time alerts linked to brokerage accounts, allowing traders to quickly manage positions during volatile market conditions.
U.S. Market Focus
These platforms are tailored to the U.S. stock market, offering real-time coverage of the NYSE, NASDAQ, and AMEX exchanges. TrendSpider integrates with Refinitiv to deliver professional-grade market data, while Trade Ideas focuses exclusively on U.S. equities, catering to active day traders. All platforms display values in U.S. dollars and adhere to the MM/DD/YYYY date format, aligning with U.S. brokerage standards.
Pricing is consistent with U.S. market expectations. Trade Ideas plans range from about $89 to $254 per month, Tickeron subscriptions go up to roughly $250 per month, and TrendSpider starts at around $99 per month. Additionally, industry trends indicate that automated trading adoption among broker-dealers surpassed 60% by 2025, with AI trading accuracy rates ranging from 70% to 95% based on backtested strategies.
Pros and Cons

After diving into the features of these AI chart analysis platforms, let’s break down their strengths and weaknesses to help you decide which one aligns with your trading needs.
Each platform shines in its own way but also comes with trade-offs. StockioAI stands out with its advanced analytics, processing over 60 data points per second to deliver tailored Buy, Sell, and Hold signals for U.S. stock and crypto traders. However, its free tier is limited to just 5 signals, and it lacks detailed historical benchmarks.
TrendSpider specializes in automated technical mapping, drawing trendlines across multiple timeframes, and identifying more than 150 candlestick patterns. It also provides heat-mapped support and resistance zones, making it a great choice for swing traders seeking visual clarity. While its backtesting and strategy testing tools enhance risk management, the $99/month starting price and absence of explicit risk calculators might deter those on a budget.
Trade Ideas is designed for active day traders, with its "Holly" AI engine running millions of simulated trades daily. It delivers high-frequency, real-time U.S. equity signals at $89/month. However, it lacks the depth of automated charting found in some competitors and does not include built-in risk calculators.
Tickeron offers an affordable entry point at $60/year for basic signals, covering stocks, ETFs, and crypto with AI-driven pattern forecasting. While its cost is appealing, its 3.5/5 rating highlights limitations in pattern recognition depth and strategy consistency. Additionally, its advanced bot features can cost up to $250/month.
Here’s a side-by-side comparison of how these platforms perform across key categories:
| Platform | Trend Detection | Support/Resistance Mapping | Risk Management | U.S. Market Relevance |
|---|---|---|---|---|
| StockioAI | AI pattern recognition with 60+ real-time data points/second; analyzes multiple timeframes | Interactive charts highlighting support, resistance, pivots, and price zones | Risk calculators with stop-loss suggestions, position sizing, and risk-reward ratios | Real-time stock and crypto analytics; priced at $79.99/month |
| TrendSpider | Auto-trendlines, multi-timeframe overlays, and ML-driven pattern recognition | Automated zones with heat maps and 150+ candlestick patterns; multi-timeframe support/resistance | Backtesting, strategy testers, and trading bots for position sizing | Scans NYSE and NASDAQ stocks; starts at $99/month |
| Trade Ideas | "Holly" AI engine running millions of simulated trades; real-time high-probability setups | 1-click trading from charts | Signal-based alerts and automated execution; no explicit risk calculators | Focused on U.S. equities; starts at $89/month |
| Tickeron | AI pattern screener for head-and-shoulders, triangles, and channels | Visual support and resistance insights | Trading bots, portfolio trackers, and risk calculators | Covers stocks, ETFs, and crypto; basic signals at $60/year, premium features up to $250/month |
All platforms support USD accounts and major exchanges. If you’re an active trader, TrendSpider and Trade Ideas excel in automation and speed. StockioAI offers a well-rounded option with strong analytics and accessible risk management tools. For beginners or cost-conscious users, Tickeron provides an affordable starting point, though its performance may vary, requiring careful strategy validation. The right choice depends on your trading style - whether you focus on day trading, swing strategies, or a balanced approach to risk management.
Conclusion
AI chart analysis has become a practical tool for U.S. traders, offering a reliable way to make informed decisions. By processing real-time market data, these platforms use machine learning to identify trends, breakouts, and reversals - providing clear trade signals and specific price levels. This automation eliminates subjective errors in charting, allowing traders to efficiently track hundreds of U.S. stocks and cryptocurrency pairs simultaneously.
To sum up our comparison: StockioAI stands out as a straightforward option for precise trend detection and risk management. It combines AI-driven pattern recognition with interactive chart overlays and risk calculators, all seamlessly integrated with USD-based trading. For U.S. traders looking for an easy-to-use platform that unifies equities and crypto analysis, this solution simplifies the transition from raw data to actionable trade decisions.
For those who need more extensive backtesting or institutional-grade features, TrendSpider or Trade Ideas might be a better fit, although these options come with a steeper learning curve and higher costs. Ultimately, choosing the right tool depends on your trading style: day traders will appreciate real-time intraday scanning and quick alerts, while swing and position traders may find greater value in multi-timeframe analysis and end-of-day scans that validate strategies across years of historical data.
FAQs
How does StockioAI use AI to enhance trend detection for traders?
StockioAI uses advanced machine learning algorithms to take the guesswork out of trading. It analyzes market patterns, identifies potential trend reversals, and highlights key support and resistance levels. This streamlines technical analysis, giving traders a clearer picture of market movements.
Thanks to its AI-powered insights, StockioAI helps traders quickly uncover opportunities and assess risks, making it a valuable companion in today’s fast-moving markets.
How does StockioAI help traders manage risk effectively?
StockioAI equips traders with AI-powered tools that take the guesswork out of risk management. From position sizing to stop-loss calculations and leverage adjustments, these features are designed to help reduce potential losses while uncovering opportunities for profit.
By combining real-time data with advanced analytics, StockioAI supports traders in making well-informed decisions. This ensures they maintain a thoughtful balance between risk and reward, even in unpredictable market conditions.
How does StockioAI meet the specific needs of U.S. traders?
StockioAI is specifically designed with U.S. traders in mind, ensuring its features align with local standards. It uses the dollar ($) for currency, follows U.S. date formats, and incorporates measurement preferences, allowing for smooth integration with the tools and data traders in the U.S. depend on.
With features like AI-powered pattern recognition, support and resistance mapping, and interactive charts, StockioAI equips traders to spot trends and make quick, well-informed decisions. By streamlining technical analysis, it provides both beginners and seasoned traders with a tool that's both easy to use and highly effective.