Crypto markets are volatile, operating 24/7 with unpredictable price swings influenced by tweets, regulatory updates, and trading bots. Predicting this volatility requires advanced tools, and feature engineering plays a key role in improving accuracy.
Key Takeaways:
- AI models like LSTM and Bayesian Networks analyze complex patterns better than traditional methods.
- Effective features include technical indicators (e.g., RSI, MACD), price-based metrics (e.g., log returns), and blockchain data (e.g., transaction volumes, whale movements).
- Tailoring features to specific assets (e.g., Bitcoin vs. Ethereum) improves results.
- Platforms like StockioAI process 60+ real-time data points to generate actionable trading signals.
Why It Matters:
By combining diverse data sources - price trends, blockchain activity, and market sentiment - feature engineering helps traders make informed decisions, manage risks, and adapt to changing market conditions.
Read on to learn how these techniques are transforming crypto trading.
James Ross: Synth AI, Subnet 50, Volatility Predictions, DeFAI Data Layer on Bittensor, BTC
| Ep. 64

Feature Engineering Methods for Volatility Prediction
Feature engineering transforms raw cryptocurrency data into meaningful inputs for AI models predicting market volatility. This process involves carefully selecting and creating features that reflect various market behaviors, from price trends to blockchain activity. Research indicates that thoughtful feature selection can boost prediction accuracy by up to 76.7% compared to baseline models[4].
Technical Indicators for Volatility Prediction
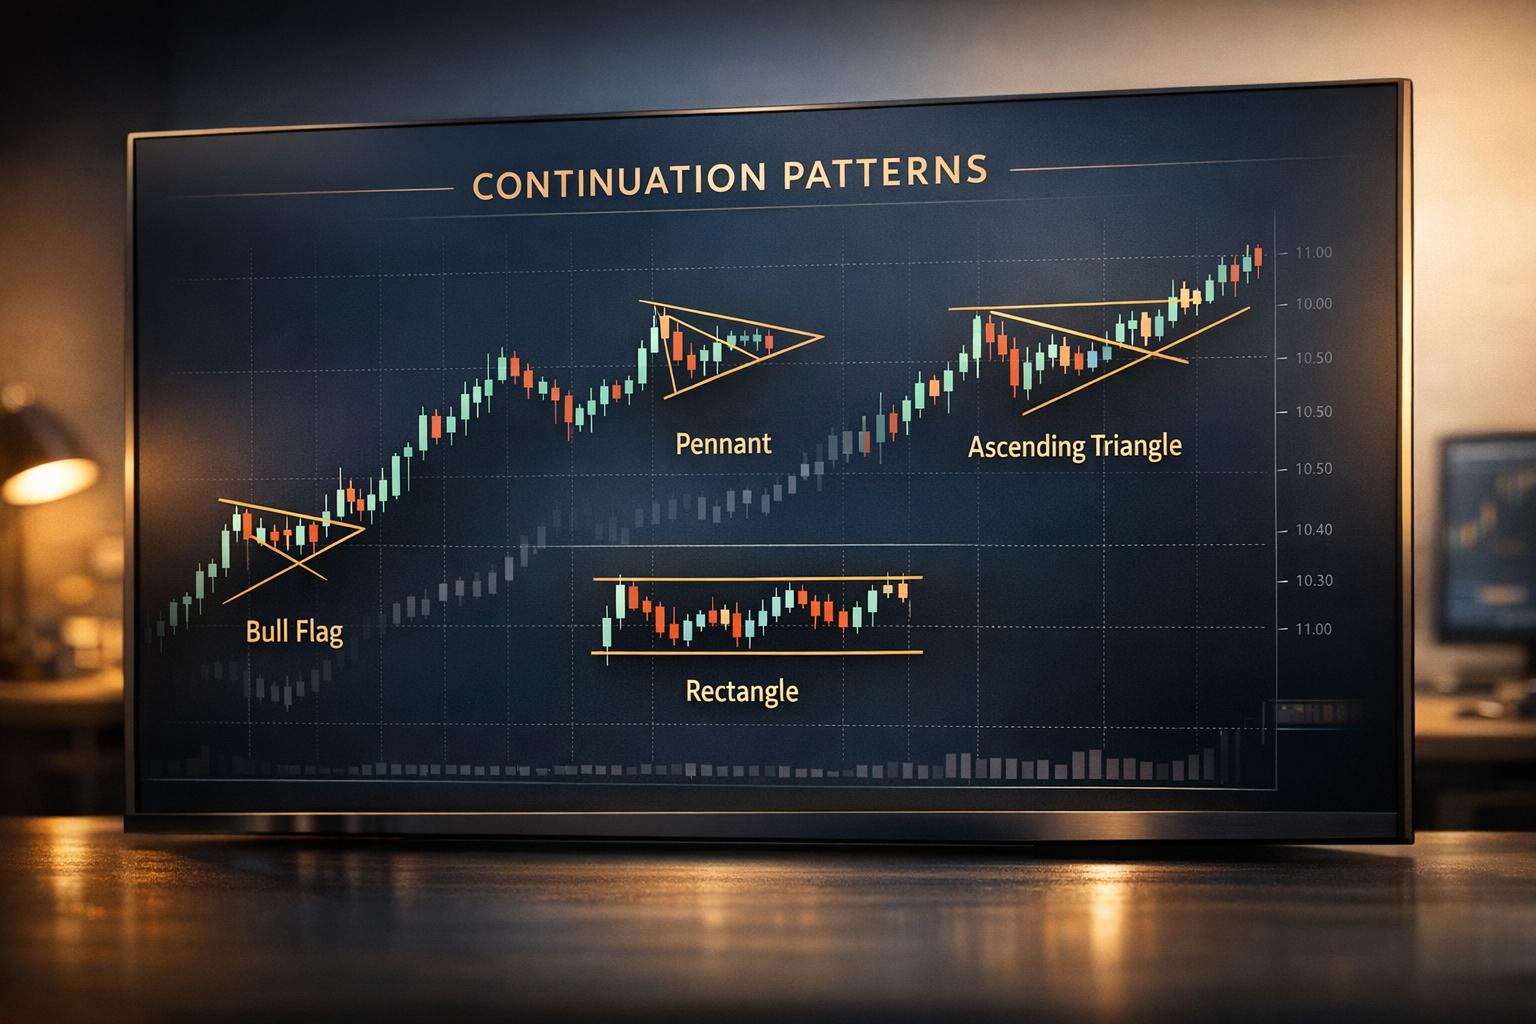
Technical indicators are the cornerstone of most volatility prediction models, offering insights into patterns hidden within price and volume data. Indicators like EMA, MACD, RSI, and Bollinger Bands are widely used for their effectiveness.
Momentum and volatility indicators are particularly useful for short-term forecasts. For instance, RSI helps identify whether an asset is overbought or oversold, while MACD tracks momentum shifts by comparing short-term and long-term moving averages. Bollinger Bands provide dynamic support and resistance levels that adjust with market volatility.
Interestingly, research shows Bitcoin responds well to volatility indicators, while Ethereum benefits more from momentum-based signals[4]. This underscores the need to customize feature sets for different assets.
StockioAI enhances SELL exit signals by analyzing over 60 real-time data points, including technical, volume, support, and sentiment metrics.
This reliance on technical indicators paves the way for exploring price-based metrics that reveal deeper market movements.
Price-Based Features and Rolling Windows
Price-based features focus on the fundamental movements of cryptocurrencies by transforming raw price data into actionable insights. Metrics like returns (percentage change between periods) and log returns (which normalize extreme price swings) are particularly effective in the volatile crypto market.
Rolling windows help smooth out short-term fluctuations to highlight longer-term trends. For example, a 7-day rolling average can show the market's general direction, while a 30-day window captures broader cycles. These features help models uncover recurring patterns and detect sudden shifts that often signal volatility spikes.
Analyzing returns across different timeframes - ranging from minutes to days - adds depth to predictions. Log returns are especially valuable for handling the dramatic price swings that are common in cryptocurrencies.
Incorporating blockchain-specific metrics alongside price data further strengthens prediction models.
Blockchain-Specific Metrics
Cryptocurrencies provide a unique advantage over traditional assets by generating data directly from their blockchain networks. Metrics like transaction counts, active addresses, hash rates, and network fees offer insights into network activity and user behavior beyond just price movements.
Signals such as transaction volumes and whale movements are particularly telling. Large transactions by major holders often precede significant market moves, while changes in active addresses can indicate shifts in user interest. Spikes in network fees frequently align with periods of heightened activity, which often correlates with increased volatility.
StockioAI integrates whale movement patterns and transaction volumes into its real-time analysis. By combining these blockchain signals with traditional indicators, the platform delivers more accurate and timely trading signals.
Market Regime Classification
Adapting feature weights to match different market regimes - whether trending, ranging, volatile, or quiet - ensures more reliable predictions. Features that excel in one market condition may underperform in another.
For instance, during trending markets, trend indicators like moving averages and directional movement are more effective. In ranging markets, oscillators such as RSI and Stochastic indicators provide stronger signals. High-volatility periods call for volatility-based features, while quiet markets benefit from volume analysis to spot emerging trends.
By dynamically adjusting feature weights based on the current market regime, models become more adaptable. This approach results in predictions that are not only more accurate but also better suited to the prevailing market environment.
| Feature Type | Best Market Conditions | Key Benefits | Example Metrics |
|---|---|---|---|
| Momentum & Volatility | Short-term, volatile periods | High accuracy for quick moves | RSI, MACD, Bollinger Bands |
| Volume & Trend | Medium/long-term, trending | Incremental improvements | OBV, EMA, SMA, ADX |
| Blockchain-specific | All conditions | Unique crypto insights | Transaction counts, whale activity |
| Market Regime | Adaptive to conditions | Improved robustness | Trending/ranging classification |
The secret to effective feature engineering lies in minimizing feature redundancy while retaining predictive strength. Studies suggest that selecting around 20 targeted indicators from a pool of over 130 can reduce overfitting and improve efficiency[4]. This ensures models remain both interpretable and effective, focusing on the key patterns needed for accurate volatility predictions.
Research Findings on Feature Sets
Research underscores the importance of selecting the right feature combinations for accurately predicting cryptocurrency volatility. Studies highlight how well-chosen features significantly enhance prediction accuracy.
Comparing Feature Sets Across Studies
Among various feature types, technical indicators consistently stand out as the most effective for predicting cryptocurrency price movements and volatility. For instance, a detailed study using Dynamic Bayesian Networks across six major cryptocurrencies found that technical indicators outperformed other features, which were grouped into four categories and included 23 distinct features[3].
The ADE-TFT model, which integrates technical, price-based, and sentiment features, achieved the lowest error rates, showing that combining multiple data sources is more effective than relying on a single feature type[5]. Similarly, LSTM models demonstrated strong performance for short-term predictions, particularly during periods of low market volatility[5].
Feature selection methods like mutual information (MI), recursive feature elimination (RFE), and random forest importance (RFI) have shown that reducing feature sets by as much as 80-85% can maintain or even improve model performance. This highlights that quality and relevance of features outweigh sheer quantity[4]. These findings emphasize the importance of carefully evaluating the strengths and limitations of each feature type.
Pros and Cons of Key Features
Each feature type offers unique advantages and challenges when applied to volatility prediction. Understanding these trade-offs is essential for designing effective models.
| Feature Type | Strengths | Weaknesses |
|---|---|---|
| Technical Indicators | Strong short-term predictive power, captures momentum shifts | Struggles in news-driven markets, risk of overfitting |
| Price-Based Features | Simple and easy to interpret, reflects historical patterns | Limited to past data, misses external shocks |
| Blockchain Metrics | Offers unique insights like transaction volume | Data quality issues, weaker short-term correlation |
| Sentiment Analysis | Tracks real-time market mood and reactions | Noisy data, hard to quantify accurately |
| Market Regime Classification | Adapts models to varying market conditions | Relies on precise regime identification |
While technical indicators excel in short-term scenarios, they often fall short during news-driven events. Blockchain metrics provide valuable perspectives unavailable in traditional markets but can be difficult to interpret. Sentiment analysis proves especially useful during periods of high volatility or significant geopolitical events[5].
Recognizing these trade-offs helps refine feature selection strategies for better prediction outcomes.
Best Feature Combinations for Prediction
To achieve the best results, feature engineering should focus on combining momentum, volatility, trend, and volume indicators, tailoring the approach to specific assets. For short-term predictions, momentum and volatility indicators deliver the highest accuracy. Adding trend and volume features enhances predictions for medium- to long-term horizons[4].
Asset-specific customization is another critical factor. For example, volatility-driven features are particularly effective for BTC/USDT, while momentum features perform better for ETH/USDT[4]. This tailored approach far exceeds the effectiveness of one-size-fits-all feature sets, especially when combined with insights from technical and blockchain-focused data.
Integrating diverse data sources is essential for robust predictions. Platforms like StockioAI excel by merging technical indicators, real-time price data, and blockchain analytics to generate actionable trading signals. This multi-source approach ensures adaptability across varying market conditions.
Feature importance shifts based on prediction horizons: technical indicators dominate for short-term forecasts, while macro and blockchain features become more relevant for long-term predictions[5]. The most effective systems dynamically adjust feature weights according to market conditions, whether the market is trending, ranging, volatile, or quiet.
Feature Engineering in AI Trading Platforms
Modern AI trading platforms have revolutionized the way traders navigate volatile cryptocurrency markets by transforming raw market data into real-time, actionable insights. This sophisticated data processing is the backbone of platforms like StockioAI, which stands out for its unique and detailed approach to feature engineering.
How StockioAI Uses Feature Engineering
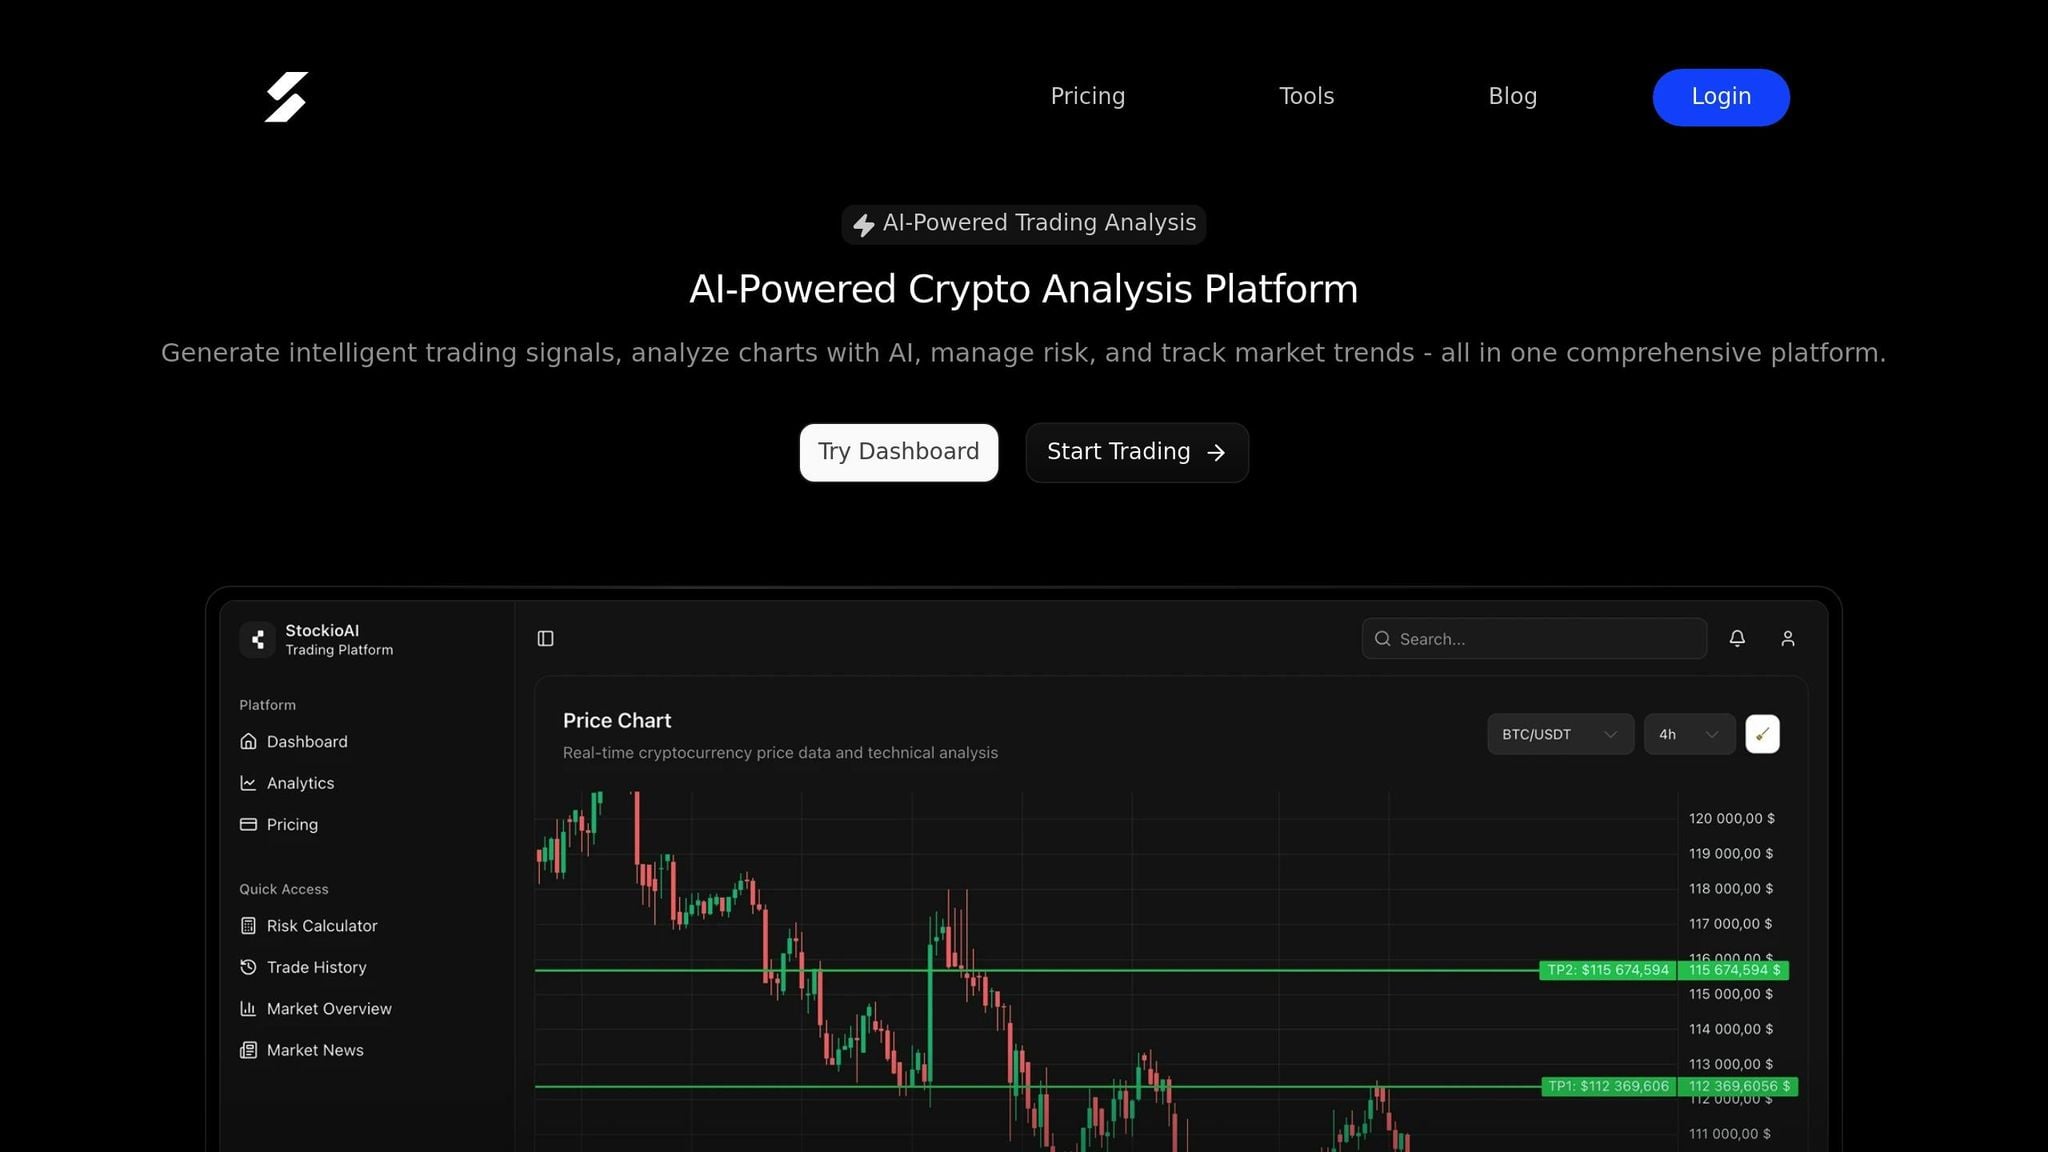
StockioAI processes over 60 real-time data points every second to produce intelligent trading signals. These data points include technical indicators, volume patterns, sentiment analysis, order book depth, blockchain metrics, and even trends from social media. By analyzing these diverse inputs, StockioAI creates precise signals that help traders make timely decisions.
The platform employs multi-timeframe analysis, allowing it to prioritize higher timeframe momentum over the noise of lower timeframes. It also uses market regime classification to identify whether the market is trending, ranging, volatile, or quiet, dynamically adjusting feature weights to suit the current conditions.
"Our intelligent trading system generates precise BUY positions based on 60+ real-time data points analyzed every second. Technical indicators, volume patterns, support levels, market sentiment, order book depth, whale movements, and social media trends are processed instantly." - StockioAI
To refine its analysis further, StockioAI uses a 7-tier priority system for evaluating features. These tiers include System Market Structure, Volume & Liquidity, Market Phase, RSI & MACD, EMA Ribbon, SMA Context, and Price Momentum. This structured approach ensures that only the most relevant features feed into its real-time processing engine.
The platform also handles conflicting signals through a conflict resolution system. By evaluating 15 distinct scenarios for position sizing based on current market conditions, StockioAI ensures traders receive clear and actionable guidance, even when market signals appear contradictory.
Real-Time Data Processing and Analytics
Real-time data processing is at the core of StockioAI's feature engineering. The platform continuously transforms raw market data - like price feeds, trading volumes, and blockchain metrics - into actionable insights. This constant processing enables the generation of precise BUY, SELL, and HOLD signals.
"Advanced AI algorithms process 60+ real-time market indicators to detect optimal exit points and generate SELL positions. Our system continuously analyzes resistance levels, momentum indicators, market trends, volatility patterns, and institutional flows to recommend when to close positions." - StockioAI
StockioAI's engineered features also power dynamic risk assessments and interactive charts. These tools allow traders to quickly spot trends, identify volatility spikes, and make informed decisions by analyzing multiple data sources simultaneously. The visual representation of processed data makes complex information accessible, enabling faster and smarter trading actions.
Benefits for U.S. Cryptocurrency Traders
For U.S. cryptocurrency traders, StockioAI's advanced feature engineering offers a significant advantage. By providing institutional-grade analytics - once reserved for large financial firms - the platform levels the playing field for individual traders.
StockioAI boasts strong performance metrics, achieving a 75.0% win rate across 35 closed trades and a profit factor of 2.95 [1]. These results demonstrate how effective feature engineering translates into tangible trading success.
The platform is tailored to U.S. market conditions, aligning its insights with local trading hours and USD pricing. Additionally, its transparency features meet U.S. regulatory standards, offering detailed explanations for each trading recommendation, including entry points, stop-loss levels, profit targets, and confidence scores.
Real-time market alerts further enhance the trading experience. Powered by engineered features, these alerts notify traders of significant market developments, enabling them to react swiftly to volatility spikes or emerging trends. This immediate access to actionable intelligence gives U.S. traders a competitive edge in the fast-paced cryptocurrency market.
StockioAI also prioritizes risk management by integrating compliance and regulatory considerations into its analytical framework. The platform maintains detailed audit trails of its feature selection and signal generation processes, ensuring that every trading recommendation is transparent and can be justified under U.S. financial standards.
Best Practices for Feature Engineering in Volatility Prediction
When it comes to predicting crypto volatility, effective feature engineering is key. It requires fine-tuned models, thorough testing, and adherence to regulatory standards to ensure dependable results in U.S. markets.
Model Optimization and Regularization
Getting the most out of a model starts with hyperparameter tuning. Methods like grid search, random search, and evolutionary algorithms - such as Genetic Algorithm and Artificial Bee Colony - are especially effective for fine-tuning models aimed at predicting cryptocurrency volatility. For instance, research has shown that using a Genetic Algorithm to adjust LSTM hyperparameters can significantly boost forecasting accuracy in crypto markets[2].
Regularization, on the other hand, is crucial to avoid overfitting, especially when dealing with the unpredictable nature of crypto data. Techniques like L1/L2 regularization, dropout layers, and early stopping help models generalize better and steer clear of memorizing noisy data.
One study highlighted the benefits of these methods: applying L2 regularization to an LSTM model reduced overfitting and improved the accuracy of Bitcoin and Ethereum volatility predictions, as measured by lower RMSE and higher directional accuracy[2]. To further refine models, combining domain expertise with statistical tests and SHAP values helps identify critical features while filtering out redundant ones that could confuse the model[2][3].
After optimization, rigorous backtesting ensures the model’s reliability in real-world scenarios.
Backtesting and Validation
Backtesting is a non-negotiable step for verifying how feature-engineered models perform in actual trading environments. One effective approach is rolling-window backtesting, which mimics real trading by training models on historical data and testing them on subsequent time periods. This technique closely aligns with live market conditions.
Another critical step is out-of-sample validation, which tests the model on data it hasn’t seen before. This helps detect overfitting and ensures the model isn’t simply memorizing patterns. It’s also a safeguard against data leakage[2][6].
To communicate results clearly, report key metrics like RMSE, MAPE, and directional accuracy using U.S.-specific formatting (e.g., $1,000.00, MM/DD/YYYY).
Backtesting also evaluates how models adapt to changing conditions, such as shifts caused by U.S. regulatory updates, major news, or market crashes. It provides traders with confidence in the model’s robustness. Additionally, cross-validation, which involves splitting historical data into multiple training and testing periods, confirms that performance remains stable across various time frames and market scenarios[2].
Transparency and Compliance Requirements
Strong model performance alone isn’t enough; transparency and documentation are equally critical for meeting regulatory standards. U.S. regulations require comprehensive documentation of every step in the feature engineering process. This includes detailing data sources, transformation methods, and model parameters. Using version-controlled code repositories ensures all changes are tracked and previous versions can be reproduced as needed.
Model explainability is becoming increasingly important for compliance. While advanced models like deep neural networks often excel in accuracy, their "black-box" nature can pose challenges. Dynamic Bayesian Networks (DBNs) offer a practical alternative by combining probabilistic inference with interpretability, making it easier for both regulators and traders to understand a model’s decision-making process[3].
Data handling must align with laws like the Gramm-Leach-Bliley Act, which mandates the protection of sensitive financial information. Models should also adhere to U.S. anti-fraud and anti-manipulation standards by maintaining clear audit trails for all trading recommendations.
Reproducibility is another cornerstone of compliance. Auditors and researchers must be able to replicate model outputs using the same data and parameters. This requires meticulous documentation of data preprocessing steps, feature selection decisions, and model configurations[2].
Special care is needed when dealing with missing data. Studies suggest that if missing values account for less than 1.5% of a dataset, simply omitting them can yield more accurate results than using interpolation[6].
As the demand for transparency in AI-driven financial tools grows, models must clearly explain their predictions. This includes providing confidence scores and ranking the importance of features to help traders and regulators understand the logic behind trading decisions[3]. Proper documentation and reproducibility not only uphold market integrity but also build trust with regulators.
Conclusion
Feature engineering plays a critical role in predicting cryptocurrency volatility, transforming raw data into meaningful insights that drive better decision-making. Research shows that models built with well-crafted features consistently deliver stronger results than those relying solely on raw data. Machine learning techniques like LSTM networks and Random Forests have proven to outperform traditional GARCH models across numerous performance metrics[2].
Studies analyzing nearly 20,000 cryptocurrencies highlight that lagged volatility and moving average volatility are among the most influential factors. Additionally, technical indicators have emerged as the most reliable predictors across various feature categories[2][3]. Models that incorporate data from multiple cryptocurrencies outperform single-asset approaches, effectively capturing the intricate and interconnected nature of today's crypto markets[2]. These findings directly shape how AI trading platforms operate in real-world conditions.
StockioAI is a prime example of research-driven feature engineering in action. The platform processes over 60 real-time data points every second, combining technical indicators, volume trends, and blockchain metrics to deliver intelligent trading signals. This approach demonstrates how advanced feature engineering can transform academic insights into tangible trading performance[1].
For U.S. cryptocurrency traders, platforms like StockioAI meet the unique demands of the market by integrating blockchain-specific metrics with traditional technical indicators. This combination provides a deeper understanding of cryptocurrency markets, capturing elements like privacy, decentralization, and network activity - factors that traditional financial models often overlook[3]. Moreover, these systems are designed to align with U.S. transparency and regulatory requirements, ensuring both compliance and adaptability in real-time.
While accuracy remains a key focus, the growing use of explainability tools like SHAP values ensures that traders and regulators can better understand how these models make decisions[2]. As the cryptocurrency landscape continues to evolve, feature engineering serves as the bridge between market unpredictability and profitable strategies, turning volatility into an opportunity for those equipped with the right tools.
Looking ahead, the platforms that successfully integrate diverse data features while maintaining transparency and regulatory compliance will lead the way in the U.S. cryptocurrency market, setting the standard for sustainable success.
FAQs
How does feature engineering help improve cryptocurrency market volatility predictions?
Feature engineering is a key step in improving the accuracy of cryptocurrency market volatility predictions. It involves turning raw data into meaningful inputs that AI models can use effectively. By crafting relevant features - like price trends, trading volumes, or market sentiment - AI systems gain a deeper understanding of the market's intricate behaviors, leading to more precise predictions.
Platforms such as StockioAI combine feature engineering with AI-driven tools to deliver practical insights for traders. These include real-time trading signals and detailed risk analyses, helping users navigate the fast-paced cryptocurrency market with greater confidence.
What are the benefits of using blockchain-specific metrics to predict cryptocurrency market volatility?
Blockchain metrics like transaction volume, wallet activity, and on-chain liquidity offer a window into cryptocurrency market behavior that traditional financial indicators often miss. These data points reveal patterns and trends unique to the blockchain ecosystem.
By integrating blockchain data into volatility prediction models, traders and analysts can sharpen their understanding of market dynamics. This added layer of insight is especially valuable in the fast-paced, decentralized world of cryptocurrencies, where traditional tools alone may fall short.
How does StockioAI use data to generate reliable trading signals for cryptocurrency traders?
StockioAI leverages real-time market data, cutting-edge technical indicators, and AI-powered pattern recognition to generate precise trading signals. By interpreting market trends and pinpointing critical patterns, it empowers traders to make informed decisions with greater confidence.
The platform’s AI continuously analyzes massive datasets to deliver actionable insights, such as BUY, SELL, and HOLD signals. This ensures users can stay ahead in the ever-changing cryptocurrency market.