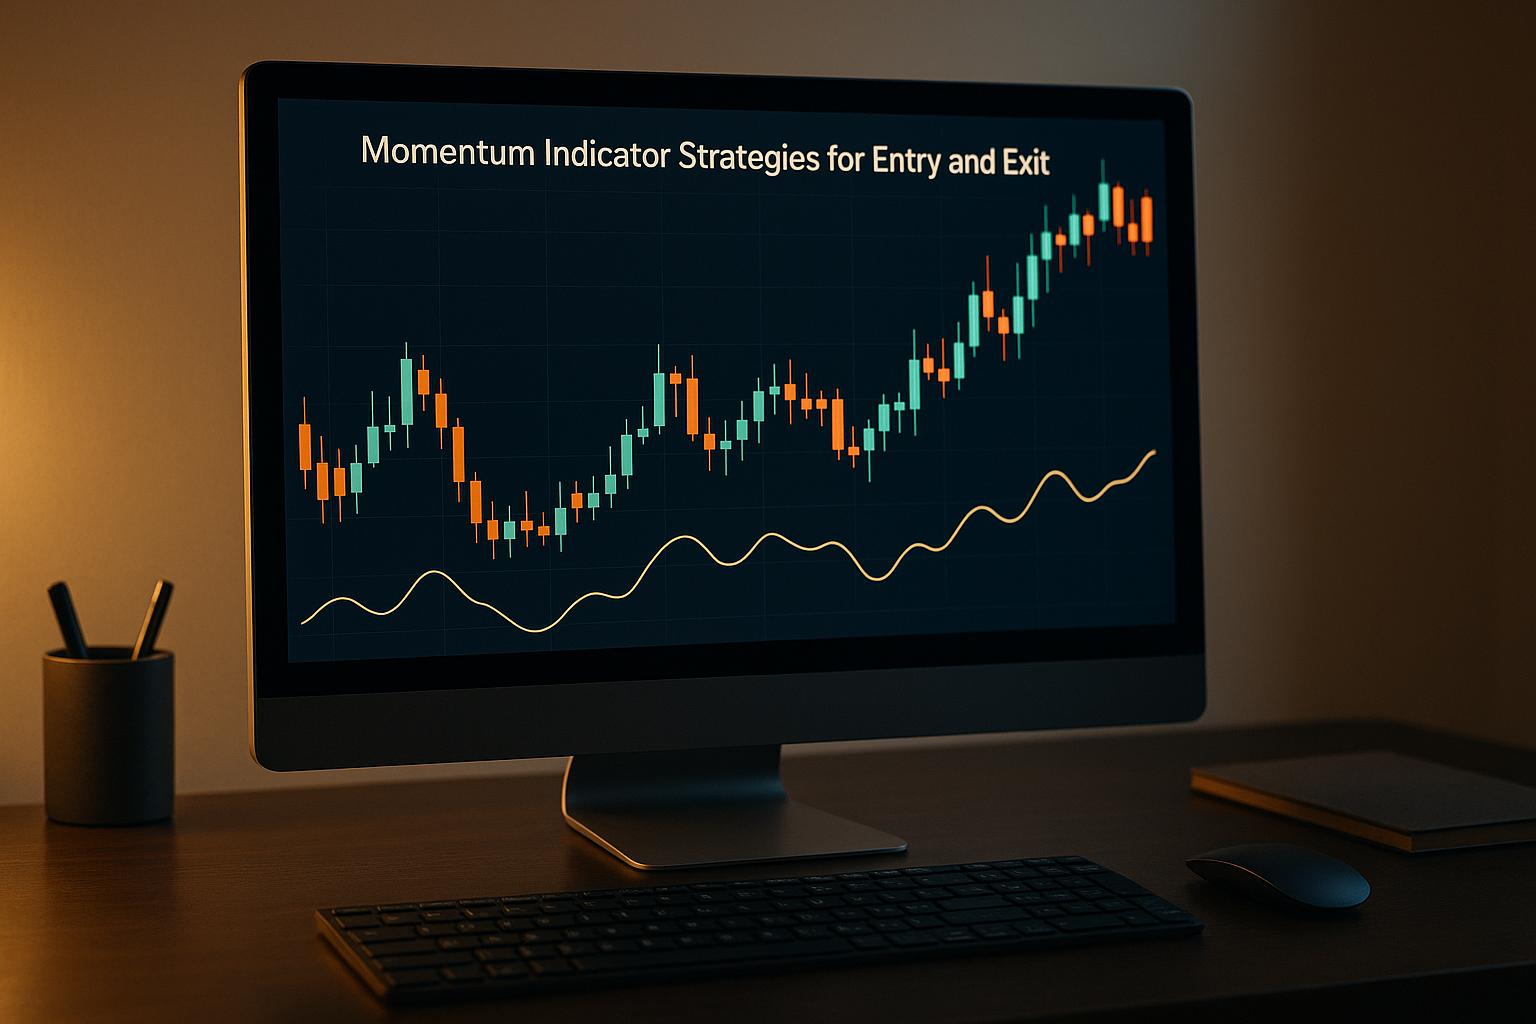
Momentum indicators help traders decide when to enter or exit trades by analyzing the speed and strength of price movements. In volatile markets like cryptocurrency, these tools simplify decision-making by providing data-driven signals. Key momentum indicators include:
- RSI (Relative Strength Index): Identifies overbought (above 70) or oversold (below 30) conditions.
- MACD (Moving Average Convergence Divergence): Detects trend shifts via signal line crossovers.
- Stochastic Oscillator: Highlights momentum shifts relative to recent price ranges.
- Momentum Oscillator: Tracks the rate of price change (above/below 100 indicates trend direction).
- Adaptive Momentum Indicator: Adjusts to market volatility for clearer signals.
AI tools, like StockioAI, enhance these indicators by automating analysis, generating real-time trade signals, and reducing emotional biases. Strategies such as trend following, divergence trading, and multi-timeframe confirmation leverage these indicators for precise trade timing. Success requires combining these tools with strict risk management, including stop-loss orders and position sizing.
Momentum trading thrives in crypto markets due to their constant price fluctuations, but discipline and proper execution remain critical for consistent results.
MOMENTUM Trading Strategy 💥🚀 (+TradingView Indicator Included)

5 Key Momentum Indicators for Crypto Trading
Having the right momentum indicators at your disposal can make a world of difference when navigating the ever-changing cryptocurrency markets. These tools help traders make smarter, data-driven decisions by capturing market momentum and signaling potential trading opportunities.
Relative Strength Index (RSI)
The Relative Strength Index (RSI) is a popular tool for measuring price momentum on a scale from 0 to 100. It doesn’t require any special calibration, making it straightforward to apply across different cryptocurrencies.
- Over 70: Signals that prices may be overbought, suggesting a potential correction.
- Under 30: Indicates oversold conditions, often seen as a buying opportunity.
Key signals occur when the RSI crosses above 30 (buy) or dips below 70 (sell). Additionally, readings between 40 and 60 can help traders distinguish between trending and sideways markets. Divergences between RSI and price action can strengthen these signals. For example, if the price hits lower lows while the RSI shows higher lows, it may hint at weakening downward momentum - a potential long entry point.
Moving Average Convergence Divergence (MACD)
The MACD is a go-to indicator for spotting momentum changes and trend direction. It’s based on the interaction of two exponential moving averages (typically 12-period and 26-period) and a signal line (usually a 9-period EMA of the MACD line).
- Bullish Signal: When the MACD line crosses above the signal line.
- Bearish Signal: When the MACD line crosses below the signal line.
The MACD histogram, which represents the difference between the MACD and the signal line, provides additional clues. Larger bars indicate stronger momentum, while shrinking bars may signal a weakening trend. Divergences between price and MACD can also point to potential reversals. For instance, if prices hit new highs but the MACD fails to follow suit, it could signal a trend losing steam.
Stochastic Oscillator
The Stochastic Oscillator is all about comparing a cryptocurrency’s closing price to its recent price range. It uses two lines - %K and %D - to highlight momentum shifts.
- Entry Signal: When the oscillator crosses above 20, signaling upward momentum.
- Exit Signal: When it dips below 80, suggesting overbought conditions.
This indicator works especially well in range-bound markets, helping traders identify turning points near support and resistance levels. When %K crosses %D in these zones, it often signals a shift in momentum.
Momentum Oscillator
The Momentum Oscillator measures the rate of price change over a set period, offering a direct way to gauge trend strength and spot reversals. Unlike bounded indicators like RSI, it is unbounded, meaning it can scale indefinitely and may need adjustments for different cryptocurrencies.
- Above 100: Indicates upward momentum and potential entry points.
- Below 100: Suggests downward momentum and possible exit signals.
It’s particularly useful for confirming trends rather than generating standalone signals. For instance, bearish divergence - when prices reach new highs but the oscillator doesn’t - can warn of a potential reversal.
Adaptive Momentum Indicator
The Adaptive Momentum Indicator takes a more dynamic approach by adjusting its parameters based on market volatility. Unlike traditional indicators with fixed settings, this tool adapts to rapid price changes or calmer periods, filtering out noise during choppy conditions.
Its ability to adjust in real-time makes it especially valuable in the highly volatile crypto market. While specific implementations may vary, the core idea remains consistent: adapt to changing market conditions to better track momentum shifts.
| Indicator | Signal Threshold | Best Market Condition | Primary Strength |
|---|---|---|---|
| RSI | 30/70 levels | Ranging markets | Overbought/oversold signals |
| MACD | Signal line crossovers | Trending markets | Identifying trend shifts |
| Stochastic Oscillator | 20/80 levels | Range-bound markets | Timing within consolidation |
| Momentum Oscillator | 100 level | Strong trends | Trend confirmation and divergence |
| Adaptive Momentum | Volatility-adjusted | Volatile conditions | Adjusting to market changes |
4 Momentum Trading Strategies for Entry and Exit
Here are four practical strategies for timing your crypto trades using momentum indicators. Each strategy is designed to help you navigate the dynamic crypto market while managing risk through strict stop-loss rules.
Trend Following Strategies
Trend following focuses on trading in the direction of a confirmed trend, using momentum indicators to catch sustained price movements before they lose strength.
For instance, when analyzing Bitcoin on a 1-hour chart, you can use the 21-period Momentum indicator. A cross above 100 signals a buying opportunity, while a drop below 100 suggests a selling point. Place stop-loss orders just beyond recent swing highs or lows to protect your position. For exits, monitor the momentum indicator for a reversal or a significant deviation from the 100 baseline.
The strength of trend following lies in its straightforward approach. Instead of trying to predict market tops or bottoms, you align yourself with ongoing trends identified by momentum indicators. This method is particularly effective in crypto’s volatile markets, where sustained trends can lead to notable profits.
Divergence Trading
Divergence trading involves identifying mismatches between price action and momentum indicators to anticipate potential trend reversals.
- Bullish divergence happens when the price forms a lower low, but the momentum indicator (like RSI or MACD) creates a higher low. This suggests that selling pressure is weakening, even as prices continue to drop - often signaling a potential upward reversal.
- Bearish divergence occurs when the price makes a higher high, but the indicator shows a lower high. This indicates fading buying momentum, which could precede a downward reversal.
To improve accuracy, confirm divergences with additional technical signals and always use stop-loss orders to limit risk. Keep in mind that divergences don’t always result in immediate reversals; they can persist for several periods before the trend actually changes. This strategy requires patience, which is especially important in crypto markets where false breakouts are common.
Overbought and Oversold Conditions
This strategy uses the RSI indicator to identify extreme market conditions and potential turning points.
- When RSI rises above 70, it signals overbought conditions, which could mean a pullback is on the horizon. This might be a good time to sell or tighten your stop-loss on long positions.
- When RSI falls below 30, it indicates oversold conditions, often seen as a buying opportunity.
However, these thresholds aren’t foolproof. Prices can remain in overbought or oversold territory for extended periods, especially during strong trends. For example, Bitcoin can stay above the 70 RSI level for weeks during a bull run.
To improve reliability, combine RSI signals with other indicators or price action analysis. Extreme RSI readings - like above 80 or below 20 - often indicate even stronger conditions and may require a modified approach. This strategy is particularly useful during extreme market conditions where emotions drive prices beyond typical technical levels.
Multi-Timeframe Confirmation
This method reduces false signals by ensuring momentum aligns across multiple timeframes, helping you make more informed trading decisions.
The idea is to use a longer-period momentum indicator on a higher timeframe to identify the overall trend, then switch to a shorter-period indicator on a lower timeframe for precise entry signals. For example, you might analyze the broader trend using a 24-period momentum indicator on a 4-hour chart and then use a 4-period indicator on a 15-minute chart to time your trades.
Only trade when both timeframes align. If your 4-hour chart shows bullish momentum but the 15-minute chart signals bearish, it’s better to wait for alignment rather than risk an inconsistent trade. This approach minimizes noise and helps you focus on trades with stronger momentum.
While this strategy may result in fewer trading opportunities, the trades you do take are often more reliable with better risk-to-reward ratios. Multi-timeframe confirmation is especially appealing for crypto traders who value precision and consistency over sheer volume of trades. It’s a disciplined approach that helps filter out the short-term noise common in cryptocurrency markets, leading to more confident trading decisions.
AI-Powered Tools for Momentum Trading
AI-powered tools are reshaping momentum trading by automating complex analyses and enhancing precision. Platforms like StockioAI bring real-time automation and advanced risk management to the table, eliminating guesswork and improving trade timing.
Real-Time Trading Signals
StockioAI analyzes over 60 real-time data points - such as RSI, MACD, and order book depth - to generate actionable Buy, Sell, and Hold signals. With constant monitoring, it ensures you stay ahead of momentum shifts that could signal profitable opportunities.
The platform’s AI simultaneously processes momentum indicators across multiple cryptocurrencies, assigning confidence scores to its signals. For example, when Bitcoin’s MACD confirms a trend change alongside RSI boundary shifts, StockioAI provides clear trade parameters to act on.
"StockioAI revolutionized my trading strategy. The AI insights helped me achieve consistent 18% monthly returns." - Jordan Martinez, Quantitative Trader
Each signal includes detailed trade parameters, saving you the hassle of manual calculations for position sizes or risk levels. With a 75% win rate across its trading signals, the platform significantly outperforms manual strategies, blending AI analysis with momentum indicators for better outcomes.
Interactive Chart Analysis and Risk Calculators
StockioAI integrates AI-generated trading levels with traditional momentum indicators on interactive TradingView charts. These charts allow you to overlay multiple indicators, zoom across timeframes, and mark potential entry and exit points based on AI insights.
The built-in risk calculator simplifies position sizing by instantly suggesting optimal trade amounts, stop-loss levels, and leverage based on your account size and risk tolerance. For instance, if you aim to risk no more than 2% of your portfolio, the calculator determines the exact number of units to trade and where to set your stop-loss, factoring in current market volatility and momentum.
This automation removes the emotional element from risk management. Instead of relying on gut feelings, you get precise, data-driven recommendations that align with your risk profile and the specific momentum trade setup. These tools pave the way for more advanced features like multi-timeframe confirmation and pattern recognition.
Multi-Timeframe and AI Pattern Recognition
StockioAI’s multi-timeframe analysis evaluates momentum indicators across various chart intervals, from 15-minute to daily charts, ensuring stronger signal confirmation and reducing false positives. By combining this data with AI-driven pattern recognition, the platform transforms traditional momentum analysis into a seamless, automated process.
The AI identifies intricate chart patterns that often indicate reliable momentum shifts. By examining historical price data and indicator trends, it filters out unreliable signals, offering a more refined approach than manual analysis.
For example, if RSI shows oversold conditions on a 1-hour chart but the daily chart suggests continued bearish momentum, StockioAI’s multi-timeframe analysis prevents premature trades. This ensures you act only when momentum aligns across relevant timeframes.
The platform continuously updates its pattern recognition models based on recent price action and volatility, adapting to market changes in real-time. This dynamic approach keeps the signals accurate and relevant as market conditions evolve.
Momentum Strategy Comparison
Selecting the right momentum strategy hinges on factors like your experience, risk tolerance, and the current market environment. Each approach comes with its own set of strengths and challenges, making certain strategies better suited for specific trading scenarios. Below, we break down each strategy to highlight its advantages and limitations.
Trend following strategies are a popular choice for beginners because of their simplicity and rule-based signals. For example, crossover signals provide clear entry points, making them easier to follow. These strategies tend to perform well in strong, directional markets but can falter in choppy conditions, where signals may become inconsistent.
Divergence trading is a more advanced approach, ideal for traders looking to catch early reversals. This method identifies discrepancies between price movements and indicators, signaling potential trend changes. However, divergences can persist longer than anticipated, making additional confirmation crucial to avoid premature trades.
Overbought and oversold strategies, which often rely on tools like the RSI or Stochastic Oscillator, generate signals when assets hit extreme levels. These strategies thrive in range-bound markets with well-defined support and resistance levels. That said, in trending markets, assets can remain in overbought or oversold zones for extended periods, leading to potential early exits.
Multi-timeframe confirmation enhances reliability by aligning signals across several timeframes. For instance, if bullish momentum appears on the 1-hour, 4-hour, and daily charts, the trade gains stronger validation. While this approach reduces false positives, its cautious nature may result in missed opportunities.
Strategy Comparison Table
| Strategy | Ease of Use | Signal Reliability | Market Responsiveness | Risk Level | Optimal Market Conditions |
|---|---|---|---|---|---|
| Trend Following | Easy | Moderate-High | Moderate | Moderate | Strong, trending markets |
| Divergence Trading | Advanced | Moderate | High | High | Near trend reversals |
| Overbought/Oversold | Easy | Moderate | High | Moderate | Range-bound, consolidating |
| Multi-Timeframe Confirmation | Advanced | High | Moderate | Low-Moderate | All, especially volatile |
The table illustrates the trade-offs between simplicity and effectiveness. While strategies like trend following and overbought/oversold are easier to implement, they may produce more false signals during volatile or choppy conditions. Conversely, more advanced methods like divergence trading and multi-timeframe confirmation require greater expertise but can deliver better results when executed skillfully.
Regardless of the strategy, solid risk management is essential. For example, trend following strategies benefit from trailing stops to lock in gains, while divergence trading requires tight stop-losses to counter false signals. Overbought/oversold strategies work best with predefined profit targets, and multi-timeframe confirmation allows for wider stops, balancing risk and reward.
Your strategy choice should also adapt to changing market conditions. In a strong bull market, trend following can capture sustained upward momentum. On the other hand, during range-bound or volatile periods, overbought/oversold strategies might yield better outcomes. This flexibility ensures you remain responsive as market dynamics shift.
Platforms like StockioAI simplify this process by analyzing market conditions and recommending the most suitable momentum strategy, helping traders make informed decisions with greater ease.
Conclusion: Implementing Momentum Strategies
Momentum indicators and multi-timeframe analysis offer traders the tools they need to navigate the unpredictable world of cryptocurrency markets. These strategies rely on technical analysis, disciplined risk management, and cutting-edge AI tools to identify opportunities and manage trades effectively. By analyzing trend strength and direction, momentum indicators help traders make precise decisions about when to enter and exit positions.
Using multiple indicators together can significantly improve the accuracy of trading signals. Instead of relying on a single tool like RSI or MACD, traders often look for alignment between several indicators and price action. This combination increases the likelihood of identifying high-probability trades.
AI-powered platforms, such as StockioAI, have taken momentum trading to the next level. These systems analyze vast amounts of real-time data - over 60 data points per second - including momentum indicators, volume trends, and market sentiment. They generate actionable BUY, SELL, and HOLD signals with confidence scores, giving traders a technological edge. Additionally, these platforms enable thorough backtesting, allowing traders to evaluate strategies on historical data. This process reveals key metrics like win rates, risk-reward ratios, and potential drawdowns, all while saving time by quickly processing large datasets across multiple timeframes.
Even with advanced tools, successful momentum trading requires strict adherence to risk management principles. This includes proper position sizing, the use of stop-loss orders, and clear take-profit targets. AI-powered risk calculators simplify this process by determining optimal position sizes and leverage while monitoring for exit signals based on resistance levels, momentum changes, and volatility.
The round-the-clock nature and extreme volatility of cryptocurrency markets make them an ideal playground for momentum strategies, but they also demand constant attention. Traders must adapt their approaches to shifting market conditions and confirm signals through multi-timeframe analysis. These practices help maintain a disciplined and systematic trading approach.
Lastly, no strategy is complete without discipline and emotional control. Rapid market reversals can wipe out gains if exit rules aren't followed consistently. AI tools help traders stay objective, removing emotional biases even during high-pressure situations. By combining technology with discipline and expertise, traders can better navigate the challenges of momentum trading in the crypto market.
FAQs
How can AI-powered tools like StockioAI help improve my momentum trading strategies?
AI-powered tools such as StockioAI can bring a new level of precision to your momentum trading strategies. With features like real-time trading signals and technical analysis, it helps pinpoint the best entry and exit points for your trades. The tool’s AI-based pattern recognition is especially useful for identifying key market trends and chart patterns, giving you the insights needed to make smarter decisions.
On top of that, StockioAI includes risk management tools and market analytics to help you assess trades and keep your portfolio on track. These features allow traders to navigate fast-moving markets with greater confidence, seizing opportunities as they arise.
How can I combine multiple momentum indicators to enhance the accuracy of trading signals?
Combining several momentum indicators can enhance the accuracy of your trading signals by offering a broader perspective on market trends. The key is selecting tools that work well together rather than duplicating each other's insights. For instance, you could pair a leading indicator like the Relative Strength Index (RSI) with a lagging indicator such as the Moving Average Convergence Divergence (MACD). This combination helps you spot potential entry and exit points while confirming the overall market direction.
However, be cautious not to overwhelm your analysis with too many indicators. Using excessive tools can lead to conflicting signals and make decision-making unnecessarily complicated. Stick to 2-3 indicators that fit your specific trading strategy and time frame. Make it a habit to backtest your setup regularly to ensure the chosen indicators perform well under various market conditions.
What makes the adaptive momentum indicator more effective than traditional momentum indicators in volatile markets?
The adaptive momentum indicator is particularly effective in volatile markets because it adjusts its sensitivity based on market conditions. Unlike traditional momentum indicators that rely on fixed parameters, this tool dynamically adapts to shifts in volatility, making it more responsive to sudden price changes.
This flexibility allows traders to pinpoint entry and exit points with improved accuracy, especially in fast-paced markets where standard indicators might lag or produce misleading signals. By staying in tune with current trends, the adaptive momentum indicator provides a sharper perspective on potential opportunities and risks.