The Awesome Oscillator (AO) is a momentum indicator that helps traders identify market trends and potential reversals. Created by Bill Williams, it calculates the difference between a 5-period and 34-period simple moving average (SMA) of the median price. AO is displayed as a histogram, with green bars above zero signaling bullish momentum and red bars below zero indicating bearish momentum.
Key Signals:
-
Zero Line Crossover: Indicates a shift in momentum.
- Buy: Histogram moves from below zero to above.
- Sell: Histogram moves from above zero to below.
-
Saucer Pattern: Highlights momentum bursts.
- Bullish: Two red bars (second shorter), followed by green above zero.
- Bearish: Two green bars (second shorter), followed by red below zero.
-
Twin Peaks Pattern: Detects potential reversals.
- Bullish: Two peaks below zero, second higher than the first.
- Bearish: Two peaks above zero, second lower than the first.
-
Divergences: Signals weakening trends.
- Bullish: Price forms lower lows, AO forms higher lows.
- Bearish: Price forms higher highs, AO forms lower highs.
Using AO Effectively:
- Combine with tools like RSI or MACD for confirmation.
- Use multi-timeframe analysis to align signals across charts.
- Avoid relying on AO alone; validate with broader trends and other indicators.
Risk Management:
- Always set stop-losses based on recent highs/lows.
- Use tools like StockioAI for AI-driven analysis, multi-timeframe validation, and market regime detection to avoid false signals.
The Awesome Oscillator is a valuable tool for spotting momentum shifts in crypto and other markets, but it works best when integrated into a broader strategy.
Setting Up the Awesome Oscillator on StockioAI
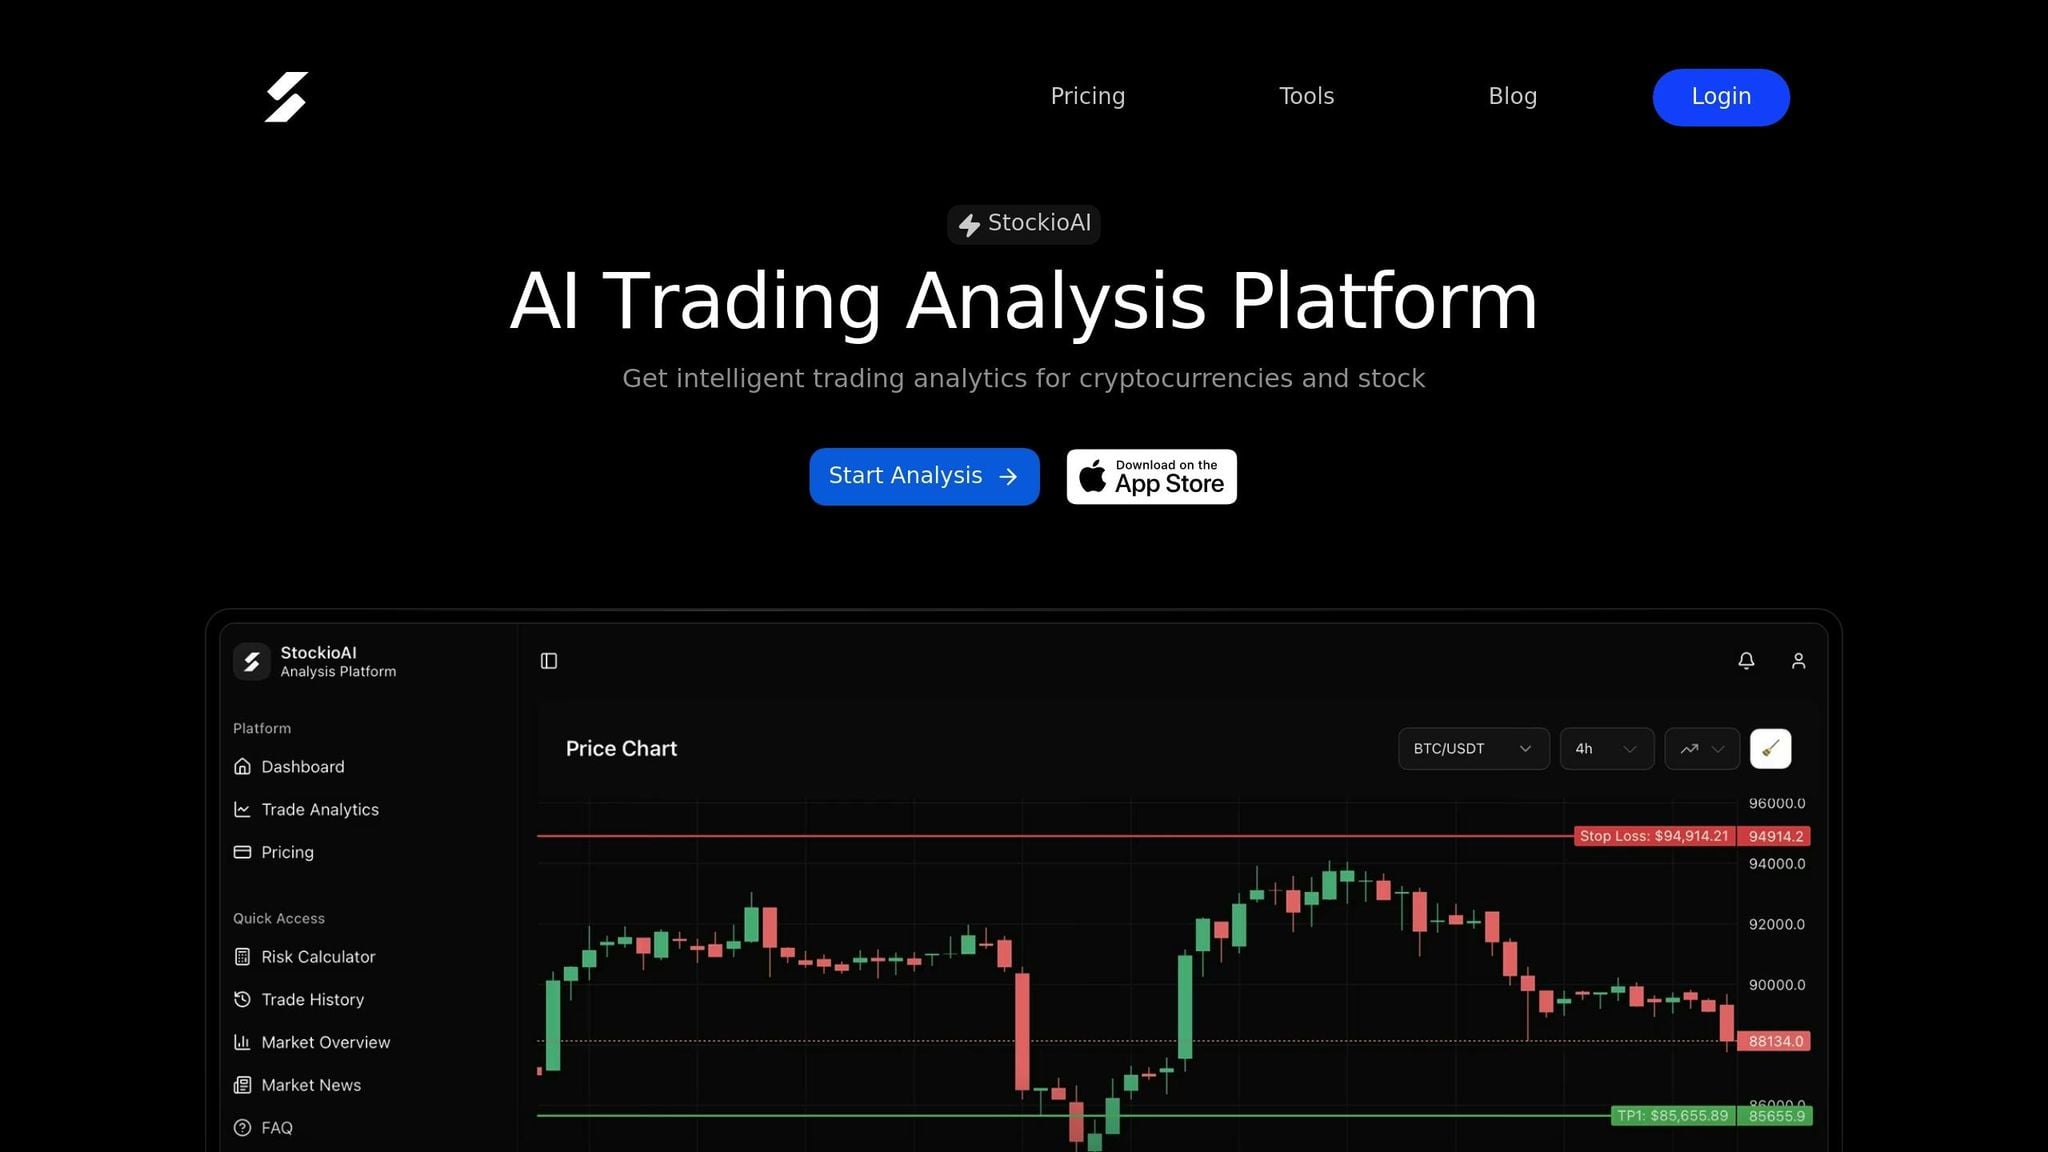
How to Access the Awesome Oscillator
To get started, open any crypto chart on StockioAI - whether it's Bitcoin (BTC), Ethereum (ETH), or Solana (SOL). From there, navigate to the Indicators or Technicals menu and add the Awesome Oscillator [9].
The AO appears as a histogram based on preset 5- and 34-period Simple Moving Averages (SMAs). You can tweak its visual settings, such as color schemes, bar thickness, and decimal precision, to suit your preferences [1][4]. For added clarity, adjust the colors to emphasize bullish or bearish trends. This setup helps the AO highlight momentum shifts, which are crucial for making informed trading decisions.
Once the AO is configured, consider using multi-timeframe analysis to validate its signals for a more comprehensive trading strategy.
Analyzing Multiple Timeframes
One of the key strengths of the AO on StockioAI is its ability to analyze multiple timeframes simultaneously. Start with daily or weekly charts to identify the broader trend and eliminate short-term market noise [1].
For traders looking to time their entries more precisely, combining different timeframes can provide deeper insights. For example, confirm the overall trend on a daily chart, then switch to shorter timeframes like 1-hour or 15-minute charts to pinpoint the best entry points [10]. StockioAI simplifies this process with its multi-timeframe analysis feature, which displays these charts side-by-side. This makes it easier to spot when momentum aligns across various timeframes - a powerful confirmation that a signal is worth acting on.
"Momentum cannot predict price movement but instead reflects the overall market's sentiment." - Nicolas Tang, Phemex Academy [5]
It's worth noting that momentum indicators like the AO tend to perform better in rising markets. Bull markets typically last longer, giving momentum more time to build [5]. By leveraging these multi-timeframe insights, traders can identify actionable buy and sell signals with greater confidence.
🔴 Top 3 Best Awesome Oscillator Trading Strategies (This is What You Must Know...)
Main Buy and Sell Signals
The Awesome Oscillator (AO) provides three key trade signals that can help traders identify market momentum and potential entry or exit points. Each signal has specific criteria, and understanding these patterns can improve your decision-making when navigating the crypto markets. Let’s break them down.
Zero Line Crossover
The Zero Line Crossover is one of the simplest signals to interpret. When the AO histogram moves from below zero to above zero, it suggests bullish momentum - short-term averages are overtaking long-term ones. On the flip side, when the histogram drops from above zero to below, it signals bearish momentum, as short-term averages are weakening.
"The strongest reversal signal appears when the awesome oscillator crosses the zero line." - CoinMarketCap Academy
To avoid acting prematurely, always wait for the bar to close before making a move. For added confirmation, align the crossover with price action - look for breakouts above resistance for buy signals or breakdowns below support for sell signals.
Saucer Pattern
The Saucer Pattern is a bit more nuanced and requires observing three consecutive bars on the same side of the zero line. A bullish saucer forms above zero when two red bars appear (with the second shorter than the first), followed by a green bar. This pattern often signals a brief pullback before the uptrend resumes. In contrast, a bearish saucer forms below zero when two green bars appear (with the second shorter than the first), followed by a red bar, hinting at a pause before the downtrend continues.
"The saucer trading signal allows analysts to identify rapid market momentum changes by looking for changes in three consecutive bars on one side of the zero-line." - Phemex
Enter trades at the opening of the fourth bar after the pattern confirms. To manage risk, set stop-losses near recent swing points. The saucer pattern is particularly effective for catching trend continuations.
Twin Peaks Pattern
The Twin Peaks Pattern focuses on identifying two peaks on the same side of the zero line. For a bullish signal, look for two peaks below zero, where the second peak is higher (closer to zero) than the first. The trough between the peaks must stay below zero, and confirmation occurs when the histogram turns green. For a bearish signal, the opposite applies - two peaks above zero, with the second peak lower (closer to zero) than the first. The trough must stay above zero, and confirmation comes when the histogram turns red. If the trough crosses the zero line, the signal becomes invalid.
This pattern is particularly useful for spotting potential reversals, complementing the momentum insights provided by AO.
| Signal Type | Zero Line Position | Pattern Requirements | Market Direction |
|---|---|---|---|
| Zero Line Crossover (Buy) | Crossing from below to above | Histogram moves from negative to positive | Bullish |
| Zero Line Crossover (Sell) | Crossing from above to below | Histogram shifts from positive to negative | Bearish |
| Bullish Saucer | Above Zero | Red → Lower Red → Green | Bullish continuation |
| Bearish Saucer | Below Zero | Green → Higher Green → Red | Bearish continuation |
| Bullish Twin Peaks | Below Zero | Two peaks; second higher than first | Bullish reversal |
| Bearish Twin Peaks | Above Zero | Two peaks; second lower than first | Bearish reversal |
Using Divergences to Spot Reversals
Divergence happens when the price moves in one direction while the Awesome Oscillator (AO) moves in the opposite direction. This mismatch signals fading momentum and hints at a possible trend reversal.
"The awesome oscillator was developed to predict momentum in the markets. It was designed to determine the strength of a trend and spot reversals." - CoinMarketCap [1]
When the price continues to trend but the AO fails to hit a matching high or low, it suggests momentum is weakening. Divergence serves as an early warning, not a definitive trade signal - always confirm with other indicators before making a move.
Below, we’ll explore how divergence can highlight potential reversals and outline actionable setups.
Bullish Divergence
A bullish divergence occurs when the price forms a lower low, but the AO forms a higher low. In this scenario, while the price is dropping to new lows, the AO hints that selling pressure is losing steam, signaling that buyers might be stepping in.
To act on this signal, wait until the AO histogram turns green, confirming the shift in momentum. Use a stop-loss just below the most recent local low to guard against false signals. For extra confirmation, check if the RSI is trending upward (ideally above 50) or look for a 9-period EMA crossing above a 21-period EMA [11].
Bearish Divergence
A bearish divergence happens when the price makes a higher high, but the AO forms a lower high. Although the price is climbing to new peaks, the AO suggests buying momentum is fading, often foreshadowing a reversal to the downside.
Enter a short trade once the AO histogram turns red, signaling weakening buying momentum. Place your stop-loss just above the most recent local high to manage your risk. For added confidence, look for an RSI below 50 or a bearish EMA crossover [11].
| Divergence Type | Price Action | AO Action | Market Signal |
|---|---|---|---|
| Regular Bullish | Lower Low | Higher Low | Potential Upward Reversal |
| Regular Bearish | Higher High | Lower High | Potential Downward Reversal |
| Hidden Bullish | Higher Low | Lower Low | Trend Continuation (Up) |
| Hidden Bearish | Lower High | Higher High | Trend Continuation (Down) |
Combining the Awesome Oscillator with StockioAI Features
The Awesome Oscillator (AO) becomes much more effective when paired with complementary tools, rather than relying on it alone. By integrating AO insights with StockioAI's advanced features, you can refine your decision-making process. StockioAI combines AI-driven signals, market regime detection, and technical indicators like RSI and MACD, providing a solid framework to validate AO setups before committing your capital.
"The Awesome Oscillator is most effective when integrated into a broader trading strategy... it is not foolproof and does print false signals from time to time." - CoinMarketCap Academy [1]
AO is great at confirming momentum shifts but doesn’t reveal whether the market is trending, ranging, or reversing. That’s where StockioAI steps in. Its AI-powered analysis and market regime detection help filter out low-quality setups and highlight trades with stronger potential for follow-through.
Confirming Signals with AI Analysis
StockioAI’s AI-generated Buy, Sell, and Hold signals can serve as your primary guide, while the AO acts as a secondary tool to confirm momentum. This layered approach helps minimize false entries, especially in low-volatility or choppy markets where AO signals can be misleading [5].
Confluence is key. For instance, if StockioAI flags a Buy signal and RSI indicates oversold conditions (below 30), wait for the AO to confirm with a bullish setup, such as a Zero Line Crossover or Saucer pattern [1]. On the flip side, if the AI detects overbought conditions (RSI above 70) and the AO forms a bearish Twin Peaks pattern, it signals a strong short setup [5].
"A buy signal is much stronger when supported by an oversold market, while overbought markets add credence to the oscillator reporting a sell signal." - Phemex [5]
The AO calculates momentum using median prices (High+Low/2) instead of closing prices, making it particularly useful for spotting divergences. For example, if StockioAI’s AI suggests a trend continuation but the AO shows divergence - such as the price forming a higher high while the AO forms a lower high - it could indicate a potential reversal [8].
However, in ranging markets, AO signals often lack follow-through, leading to unreliable outcomes [6]. StockioAI’s market regime detection helps you avoid such trades, steering you toward setups in confirmed trending markets.
| Indicator Combo | When to Use | Signal Strength |
|---|---|---|
| AI Buy + AO Zero Line Cross + RSI < 30 | Oversold trending market | High probability entry |
| AI Sell + AO Twin Peaks + RSI > 70 | Overbought trending market | High probability short |
| AI Signal + AO Divergence | Potential reversal warning | Requires extra confirmation |
| Ranging Regime + AO Crossover | Sideways/choppy market | Low probability - avoid [6] |
Once you’ve confirmed the signals, focus on managing your risk effectively with StockioAI’s tools.
Managing Risk with StockioAI Tools
After validating signals using StockioAI’s AI and technical indicators, protecting your capital should be your next priority. StockioAI’s risk calculators and position tracking tools help you size trades correctly and set stop-losses based on actual market volatility - not guesswork.
When acting on AO signals, always use a stop-loss. For bullish setups, place your stop just below the most recent local low; for bearish setups, set it just above the most recent local high. In volatile markets, consider widening your stops, even if AO shows strong momentum, as sudden price spikes can occur [7].
"The Awesome Oscillator is undoubtedly a powerful and versatile tool... but it only takes one bad trade to wipe out all of your profits." - Phemex [5]
StockioAI’s Premium Access ($79.99/month) takes your trading to the next level with automated crypto analysis every 4 hours for BTC, ETH, SOL, and XRP, along with daily updates for major stocks like AAPL, META, GOOGL, TSLA, NVDA, and AMZN. Real-time market alerts notify you when AI signals align with AO confirmations, so you can act quickly without constantly monitoring charts.
Finally, leverage StockioAI’s portfolio tracking to evaluate your AO-based trades over time. If you find consistent losses in ranging markets, consider tweaking your strategy to avoid AO signals unless the market is clearly trending. Additionally, the platform’s advanced pattern recognition can identify emerging AO setups early, giving you a strategic advantage.
Comparison of Awesome Oscillator Signals

Understanding the different signals generated by the Awesome Oscillator (AO) can help traders respond effectively to market movements. Here's a breakdown of the key signal types:
- Zero Line Crossover: This occurs when the 5-period SMA crosses the 34-period SMA, signaling a potential trend reversal.
- Saucer Pattern: This highlights momentum bursts within an ongoing trend.
- Twin Peaks Pattern: This warns of weakening momentum through contrasting peaks.
Each of these signals serves a specific purpose, making it easier to choose the right StockioAI tools for different scenarios.
How Signals Work in Different Market Conditions
Each signal type performs best under particular circumstances. Zero Line Crossovers are ideal in trending markets but can generate misleading signals during sideways price action. On the other hand, Saucer patterns work well during trend continuations, especially after brief pullbacks. However, using tools like the Accelerator Oscillator can help confirm momentum acceleration.
Twin Peaks patterns and divergence signals are more suited for identifying potential reversals. For instance, if prices keep making new highs but the AO forms a lower high, it could indicate that the trend is losing strength.
"The Awesome Oscillator is one of the best momentum indicators that you can rely on for amazing results."
– Ross Cameron, Founder, Warrior Trading [3]
Signal Comparison Table
| Signal Type | Buy Conditions | Sell Conditions | Reliability | StockioAI Confirmation Methods |
|---|---|---|---|---|
| Zero Line Crossover | Histogram crosses from below to above 0 | Histogram crosses from above to below 0 | Moderate (may give false signals in ranges) | AI Trend Filter (50-period EMA) to confirm the broader trend |
| Saucer | Above 0: Two red bars (second lower) followed by a green bar | Below 0: Two green bars (second lower) followed by a red bar | High (great for momentum continuation) | Accelerator Oscillator (AC) to confirm momentum acceleration |
| Twin Peaks | Below 0: Two peaks where the second is higher, followed by a green bar | Above 0: Two peaks where the second is lower, followed by a red bar | High (strong for reversal trades) | Automated trendline break detection on AO histogram peaks |
| Divergences | Price makes lower lows while AO makes higher lows | Price makes higher highs while AO makes lower highs | Very high (useful for major reversals) | Cross-referencing with RSI/MACD divergence for additional validation |
Additional Insights
The table above outlines the key signals and how StockioAI tools can confirm them. However, there are nuances to consider. For example, a "side zero" condition - where histogram bars hover close to the zero line - indicates consolidation or reduced momentum. In such cases, it’s better to wait until the bars move decisively away from zero before taking action. StockioAI's market regime detection can help filter out lower-probability setups by identifying ranging markets where AO signals are less reliable.
Conclusion
The Awesome Oscillator simplifies complex market data into an easy-to-read histogram, offering insights into momentum shifts. By using midpoint prices, it provides a balanced perspective on market sentiment and helps reduce the impact of sudden price volatility [2][12]. Key patterns like the Zero Line Crossover, Saucer, and Twin Peaks are highlighted, and when paired with StockioAI's tools, they can improve trade entry strategies.
While the Awesome Oscillator is effective at identifying signals, it should not be used in isolation. As CoinMarketCap Academy emphasizes:
"It is important to exercise risk management and not use the awesome oscillator alone for trading decisions" [1]
StockioAI enhances the Awesome Oscillator's signals with real-time AI-powered analysis, ensuring more reliable trading decisions. Features like market regime classification and cross-validation with indicators such as RSI and MACD help filter out false signals, especially in ranging or consolidating markets. Incorporating StockioAI's risk management tools ensures that every AO signal is thoroughly validated before a trade is executed. This approach combines precision and caution, creating a more robust trading strategy.
FAQs
How can I use the Awesome Oscillator with other indicators to improve trading signals?
To improve the accuracy of your trading signals, consider combining the Awesome Oscillator (AO) with additional indicators. This strategy can help confirm momentum shifts and filter out false signals. Start by adding the AO to your chart - it uses green bars to indicate bullish momentum and red bars to signal bearish momentum. Next, overlay a longer-term moving average, such as a 50- or 200-period Simple Moving Average (SMA), to gauge the broader trend. Stick to buy signals when the price is above the moving average and sell signals when it’s below.
To further validate your trades, incorporate another oscillator like the MACD or RSI. For example, if the AO shows a bullish crossover (green bars forming above zero), pair it with a MACD bullish crossover (when the MACD line crosses above the signal line) for a more reliable buy signal. Additionally, watch for divergences between the AO and price action. A bearish divergence - where price makes a higher high, but the AO forms a lower high - can hint at a potential reversal. Similarly, a bullish divergence, with price hitting a lower low while the AO shows a higher low, may signal an upward shift.
If manual analysis feels overwhelming, tools like StockioAI can simplify the process. These platforms integrate multiple indicators, offering real-time buy, sell, or hold alerts, which can save time and reduce errors. By layering multiple confirmation methods, you can improve your trade timing and minimize the risk of false signals, especially in the fast-moving crypto market.
What type of market conditions are ideal for using the Awesome Oscillator?
The Awesome Oscillator shines brightest in markets with clear and strong momentum. It works particularly well during pronounced upward or downward trends, as it helps confirm the trend's direction and pinpoints potential reversal points.
To get the most out of it, focus on markets where price movements are steady and trends are clearly defined. In such conditions, the oscillator can deliver more dependable buy and sell signals, making it easier to make well-informed trading decisions.
How can I manage risk effectively when trading with the Awesome Oscillator?
Managing risk when trading with the Awesome Oscillator (AO) is essential, especially if you're working with leveraged instruments like CFDs. These tools can amplify both profits and losses, so a solid risk strategy is non-negotiable. Here are some practical ways to keep your risk in check:
- Stick to conservative position sizes: Limit each trade to just 1-2% of your total account equity. This ensures no single loss can significantly dent your portfolio.
- Keep leverage in check: Use minimal leverage to avoid rapid loss accumulation, giving you better control over your trades.
- Validate AO signals: Don’t rely solely on AO. Pair its signals with other technical indicators to confirm buy or sell opportunities and reduce the chance of acting on misleading signals.
- Set clear stop-loss levels: Always define stop-loss points to cap potential losses, protecting your capital from unexpected market moves.
For extra accuracy, tools like those offered by StockioAI can be incredibly helpful. Features such as risk calculators allow you to determine the ideal position size and stop-loss levels based on your account size and risk tolerance. By following these steps consistently, you can trade smarter and manage your exposure effectively.