Finding the right chart analysis platform can make or break your trading strategy. Whether you're into stocks, crypto, or forex, the right tools help you spot trends, manage risks, and make better decisions. Here's a quick rundown of the top platforms tailored for U.S. traders:
-
StockioAI: AI-powered insights with real-time stock and crypto data. ($79.99/month for premium features)
-
TradingView: Advanced charting tools with a vibrant community. (Free to $49.95/month)
-
Thinkorswim by TD Ameritrade: Professional-grade tools for stocks and options, free for TD Ameritrade users.
-
Coinigy: Centralized dashboard for managing crypto across 46 exchanges. (Starts at $18.66/month)
-
TrendSpider: Automated trendline detection and pattern recognition. (Starts at $39/month)
-
MetaTrader 5: Multi-asset platform with extensive customization options. (Free; broker fees may apply)
-
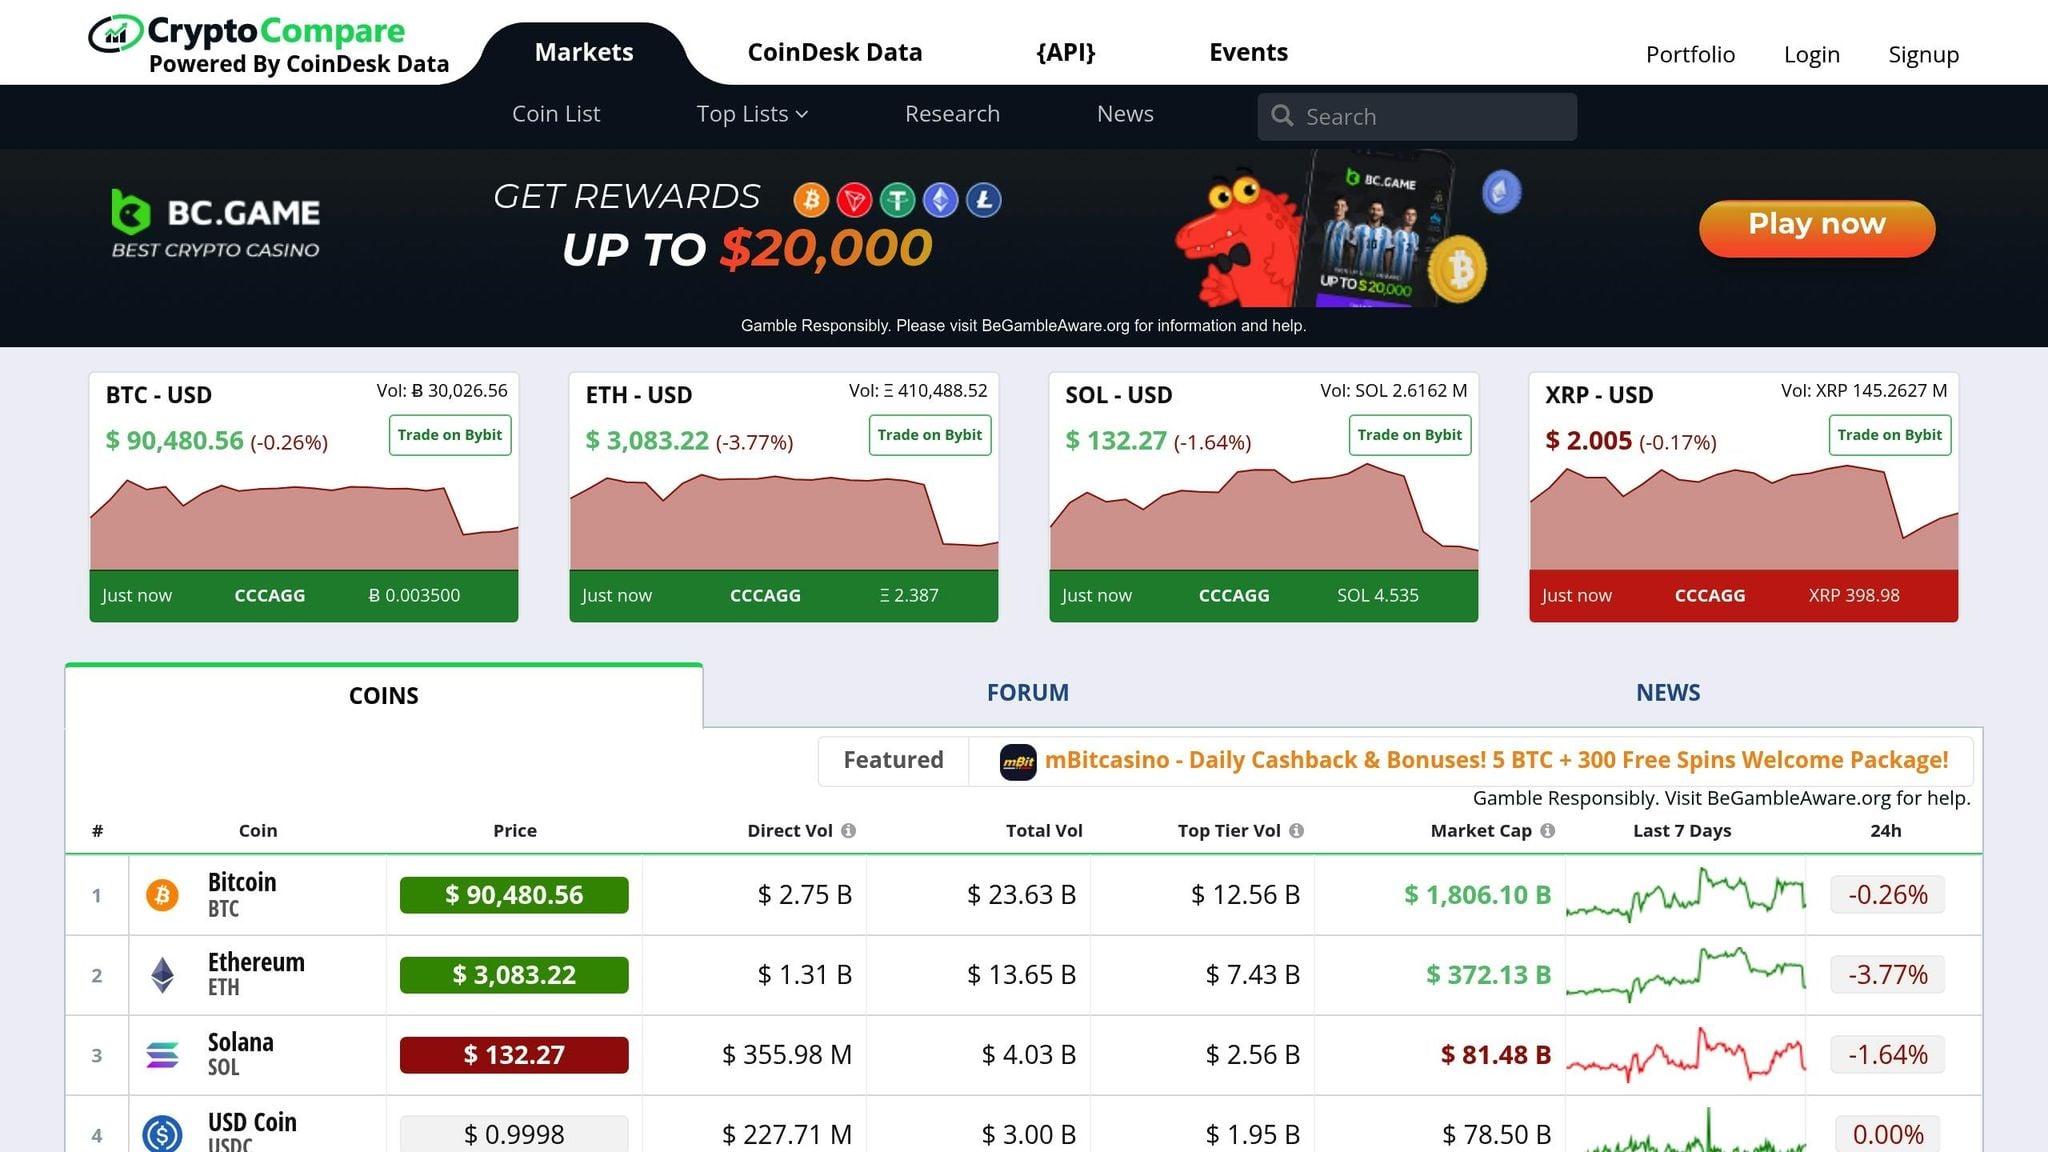
CryptoCompare: Free resource for crypto market data and portfolio tracking.
Quick Comparison
| Platform | Best For | Price | Key Features |
|---|---|---|---|
| StockioAI | AI-driven stock & crypto trading | Free; $79.99/month | AI signals, risk management tools, real-time data, 80-90% accuracy |
| TradingView | Advanced charting for stocks & crypto | Free; $12.95–$49.95 | 100+ indicators, custom scripts, multi-asset coverage |
| Thinkorswim | Active stock & options traders | Free (TD Ameritrade) | 400+ indicators, paper trading, real-time data |
| Coinigy | Crypto traders managing multiple exchanges | From $18.66/month | Integration with 46 exchanges, portfolio tracking |
| TrendSpider | Automated technical analysis | From $39/month | AI trendlines, backtesting, multi-timeframe analysis |
| MetaTrader 5 | Forex, crypto, & CFD traders | Free (broker fees) | Custom indicators, algorithmic trading, multi-asset support |
| CryptoCompare | Crypto market research | Free | Real-time data, historical trends, mining stats |
Each platform offers unique strengths, from AI-driven insights to automation and portfolio tracking. Choose based on your asset focus, trading style, and budget.

Top 3 Best Free Stock Charting Tools To Kick Start Your Trading
1. StockioAI
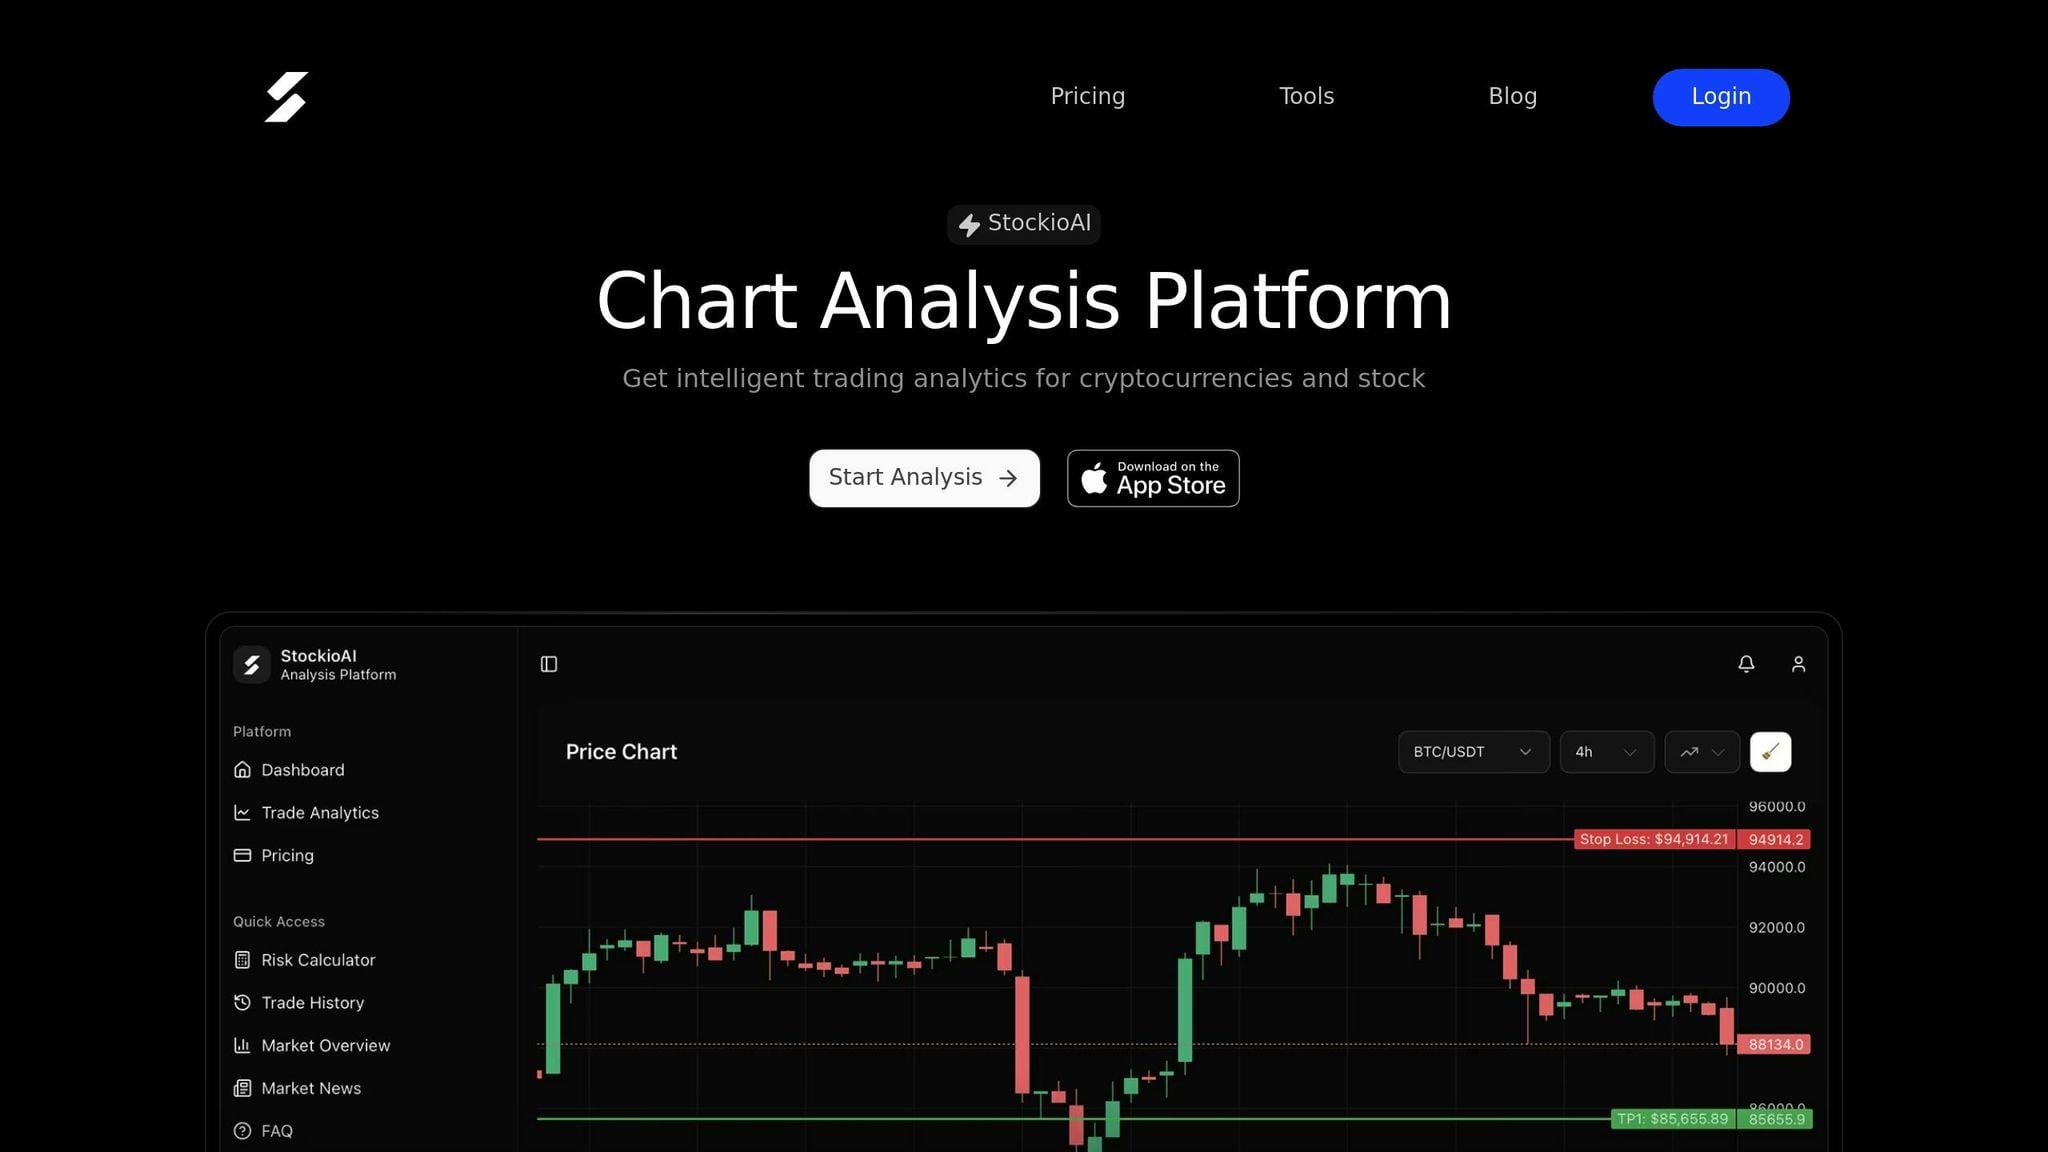
StockioAI is an AI analytics platform tailored for U.S. stock and crypto traders who want to combine technical analysis with AI-powered insights. By analyzing over 60 real-time data points - like market sentiment and whale activity - it delivers Long, Short, and Hold recommendations complete with timing, price targets, and confidence levels.
Jordan Martinez, a quantitative trader, shared: "StockioAI revolutionized my trading strategy. The AI insights helped me achieve consistent 18% monthly returns."[1]
Let’s take a closer look at what makes StockioAI stand out.
Technical Analysis Tools
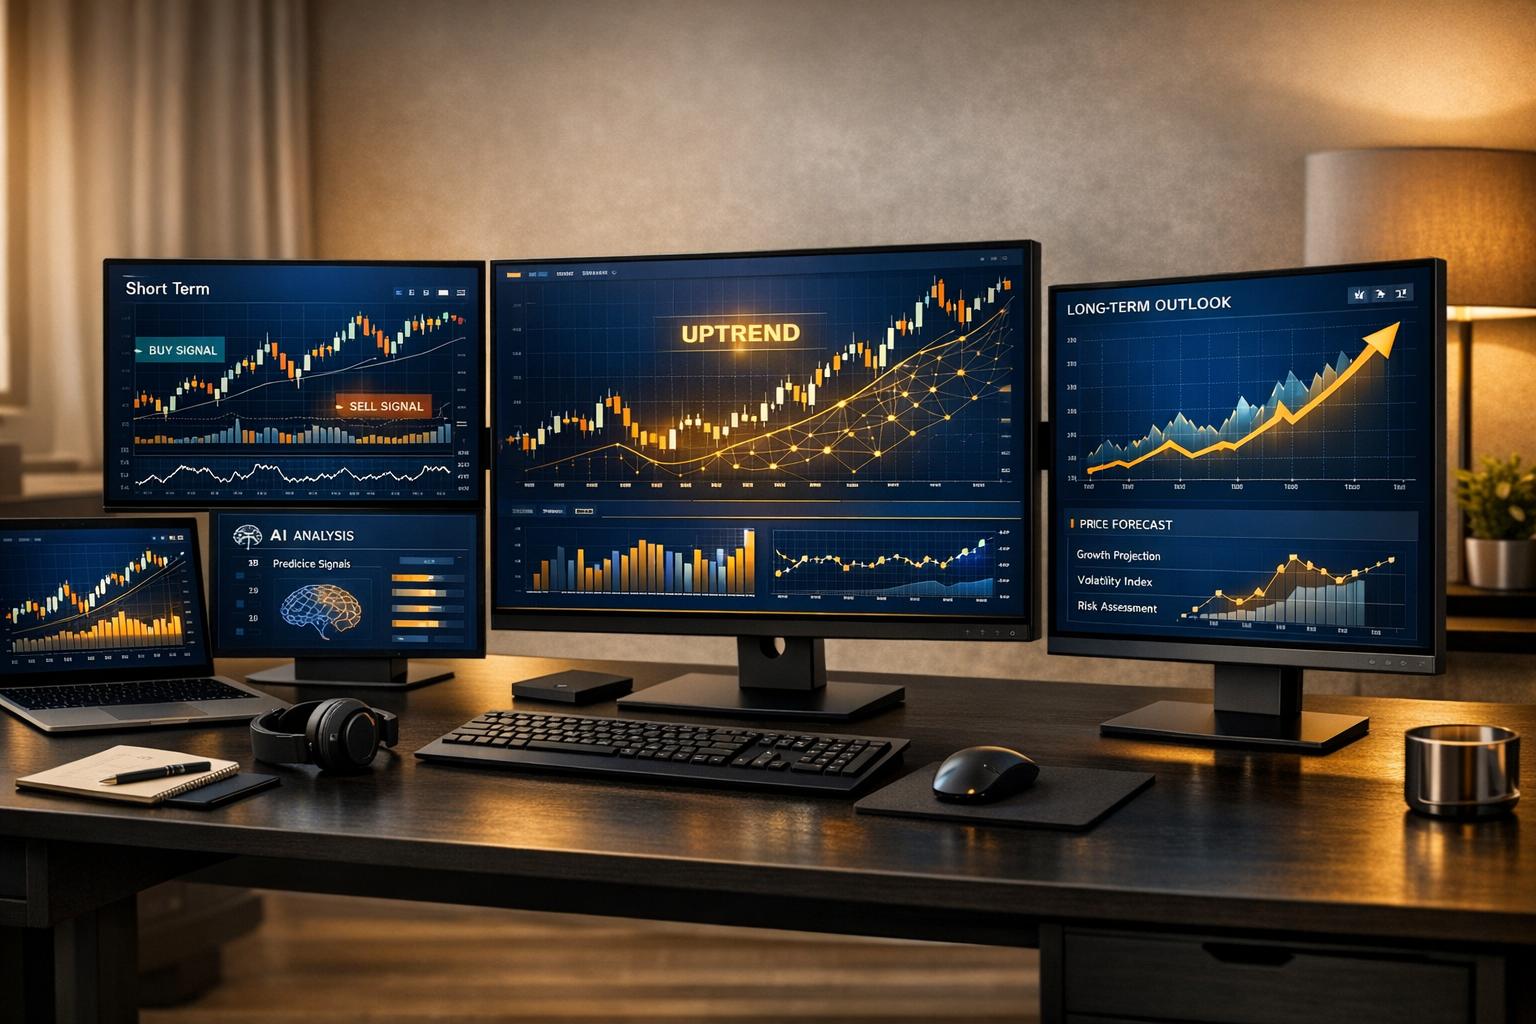
StockioAI’s Complete Analysis Dashboard brings together all essential charting tools in one place. While the free plan includes standard indicators, the Premium Access plan ($79.99/month) unlocks advanced, customizable indicators and interactive drawing tools. These allow traders to identify critical support, resistance, pivots, and price zones directly on their charts. The All-Timeframe Mastery feature supports intervals from 1-minute to monthly, making it easier to align trends across U.S. stocks and major cryptocurrencies.
AI Features and Trading Signals
StockioAI takes precision a step further with AI pattern recognition, which automatically identifies chart formations like head-and-shoulders, double bottoms, and candlestick patterns. Traders are notified in real time, ensuring they don’t miss key opportunities. Premium users enjoy unlimited AI trading signals, complete with detailed entries, targets, and reasoning, while free plan users are capped at 5 signals. Additionally, the platform’s Market Regime Classification determines whether the market is trending, ranging, volatile, or calm. It also uses higher timeframe momentum to filter out unnecessary noise from lower timeframes.
Risk Management Tools
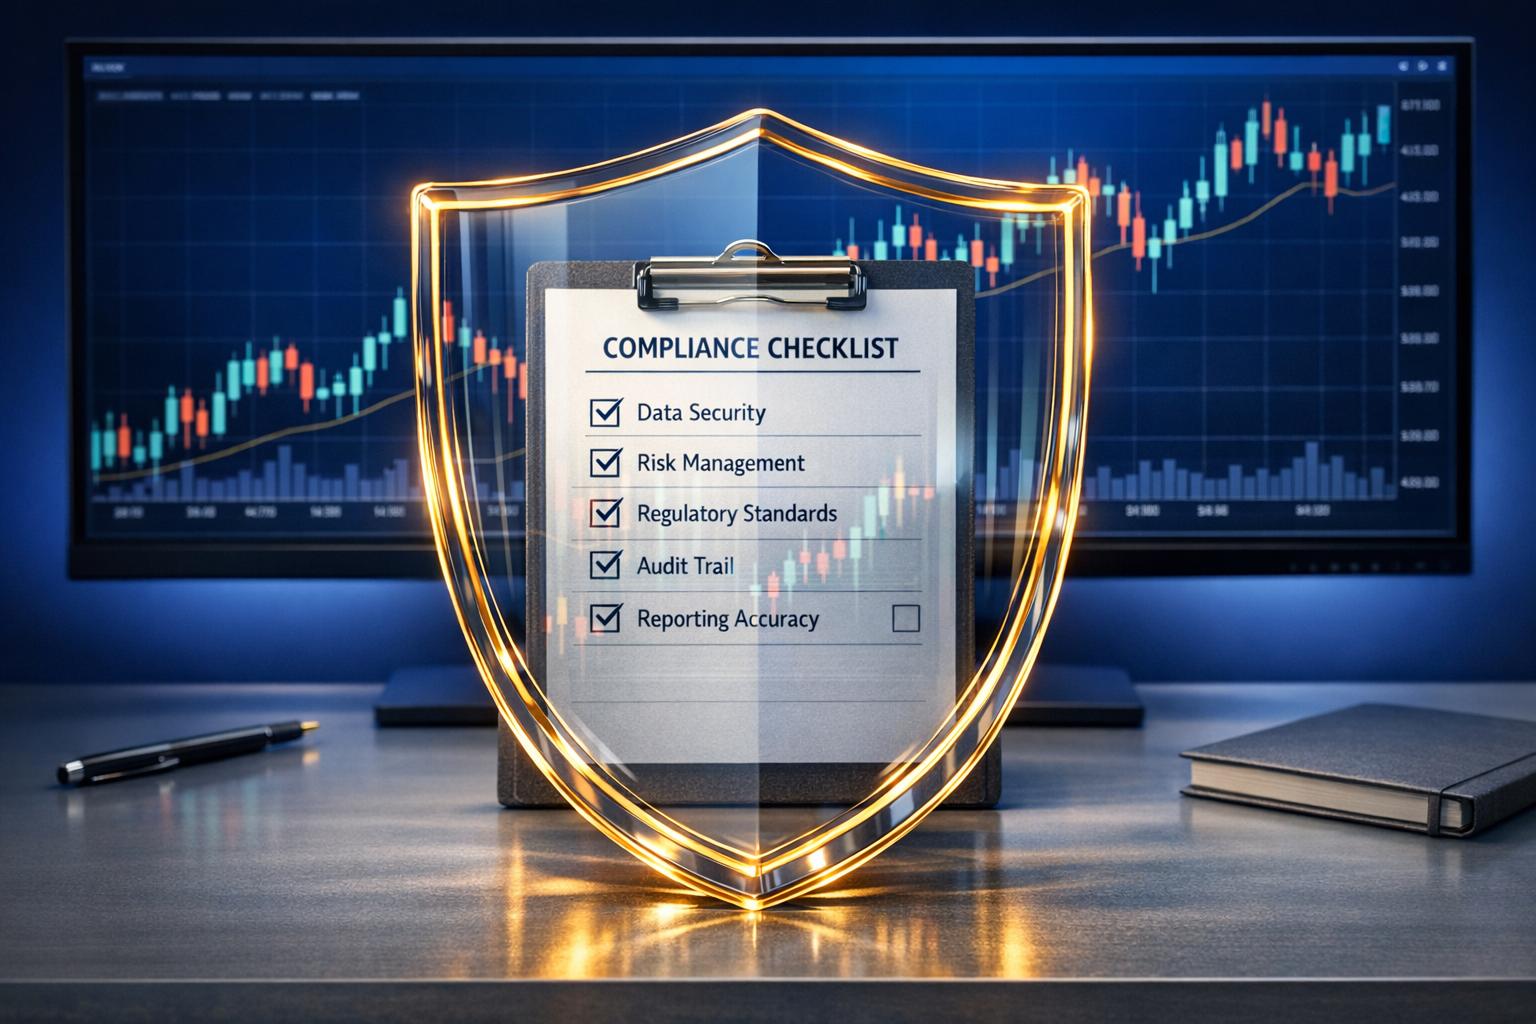
In line with the growing need for effective risk management, StockioAI offers features like stop-loss recommendations, optimal position sizing based on account equity, and risk–reward ratio calculations. The platform also includes portfolio tracking to monitor performance and drawdowns. For example, if you’re managing a $50,000 portfolio and want to risk 2% per trade, StockioAI calculates a $1,000 maximum exposure and suggests appropriate stop-loss levels.
Real-Time Data Integration
StockioAI integrates real-time data feeds from major U.S. exchanges (NYSE, NASDAQ) and leading cryptocurrency platforms (Binance, Coinbase). Premium users gain access to automated cryptocurrency analysis every 4 hours and daily stock analysis for top tickers. Additionally, the platform offers a market news feed that links price action to breaking events, ensuring traders stay informed across both U.S. exchanges and crypto markets.
| Pros | Cons | Target Audience |
|---|---|---|
| AI-driven signals reduce emotional trading; real-time U.S. stock and crypto data; intuitive risk management tools; multi-timeframe analysis in one interface | Premium features require a $79.99/month subscription; advanced AI tools may have a learning curve; free plan limits signals to 5 | Intermediate stock and crypto traders seeking AI insights; swing and day traders who value automated pattern detection and strong risk management |
2. TradingView

TradingView is a go-to, browser-based platform for advanced charting, particularly in U.S. stocks and cryptocurrencies. It combines a robust suite of tools with a user-friendly design, making it ideal for analyzing stocks during regular or extended trading hours, as well as tracking cryptocurrencies that operate 24/7.
Technical Analysis Tools
TradingView comes loaded with over 100 pre-built indicators and more than 90 drawing tools, including popular options like moving averages, RSI, Fibonacci retracements, trendlines, and custom channels [3]. One standout feature is the ability to view multiple chart timeframes - such as 1-minute, 4-hour, daily, and weekly - side by side. This allows traders to align short-term entry points with broader trends across U.S. equities or crypto pairs [2][3]. For those who enjoy customization, TradingView’s Pine Script enables users to design and backtest their own indicators and strategies, with alerts triggered when specific conditions are met. The platform also benefits from a vibrant community that shares unique scripts and ideas [4].
Risk Management Tools
TradingView simplifies risk management with its built-in long/short position tools. These allow traders to visually map out entry prices, stop-loss levels, and take-profit targets directly on their charts, while automatically calculating risk/reward ratios. For instance, buying a stock at $250, setting a stop at $240, and targeting $270 results in a 1:2 risk/reward setup. Additionally, watchlists and multi-chart layouts help users monitor exposure across correlated assets, reducing the chances of overconcentration during volatile market periods [2][4]. Beyond these features, the platform also delivers detailed real-time data for informed decision-making.
Real-Time Data Integration
TradingView complements its charting and risk tools with a broad range of real-time data. It covers U.S. stocks, over 740 cryptocurrencies, forex, indices, futures, and bonds, with many crypto pairs offering live updates [2][4]. Intraday traders can subscribe to real-time add-ons to bypass the standard 15-minute delay for U.S. stock data. The platform also supports extended-hours trading for U.S. stocks, showcasing pre-market and after-hours price movements that can influence next-day strategies. For crypto traders, the charts provide uninterrupted 24/7 pricing in Eastern Time [2][3].
| Pros | Cons | Target Audience |
|---|---|---|
| Extensive library of 100+ indicators and 90+ drawing tools; supports multiple timeframes and asset types; real-time crypto data; Pine Script for custom strategies; active community sharing scripts and ideas | Paid plans ($12.95–$49.95/month) required for some real-time U.S. stock data; lacks full integration with all U.S. brokers; primarily focused on charting rather than full-service brokerage features | Day and swing traders who rely on detailed technical analysis; systematic traders who code and test strategies; crypto traders needing 24/7 real-time charts across exchanges |
3. Thinkorswim by TD Ameritrade
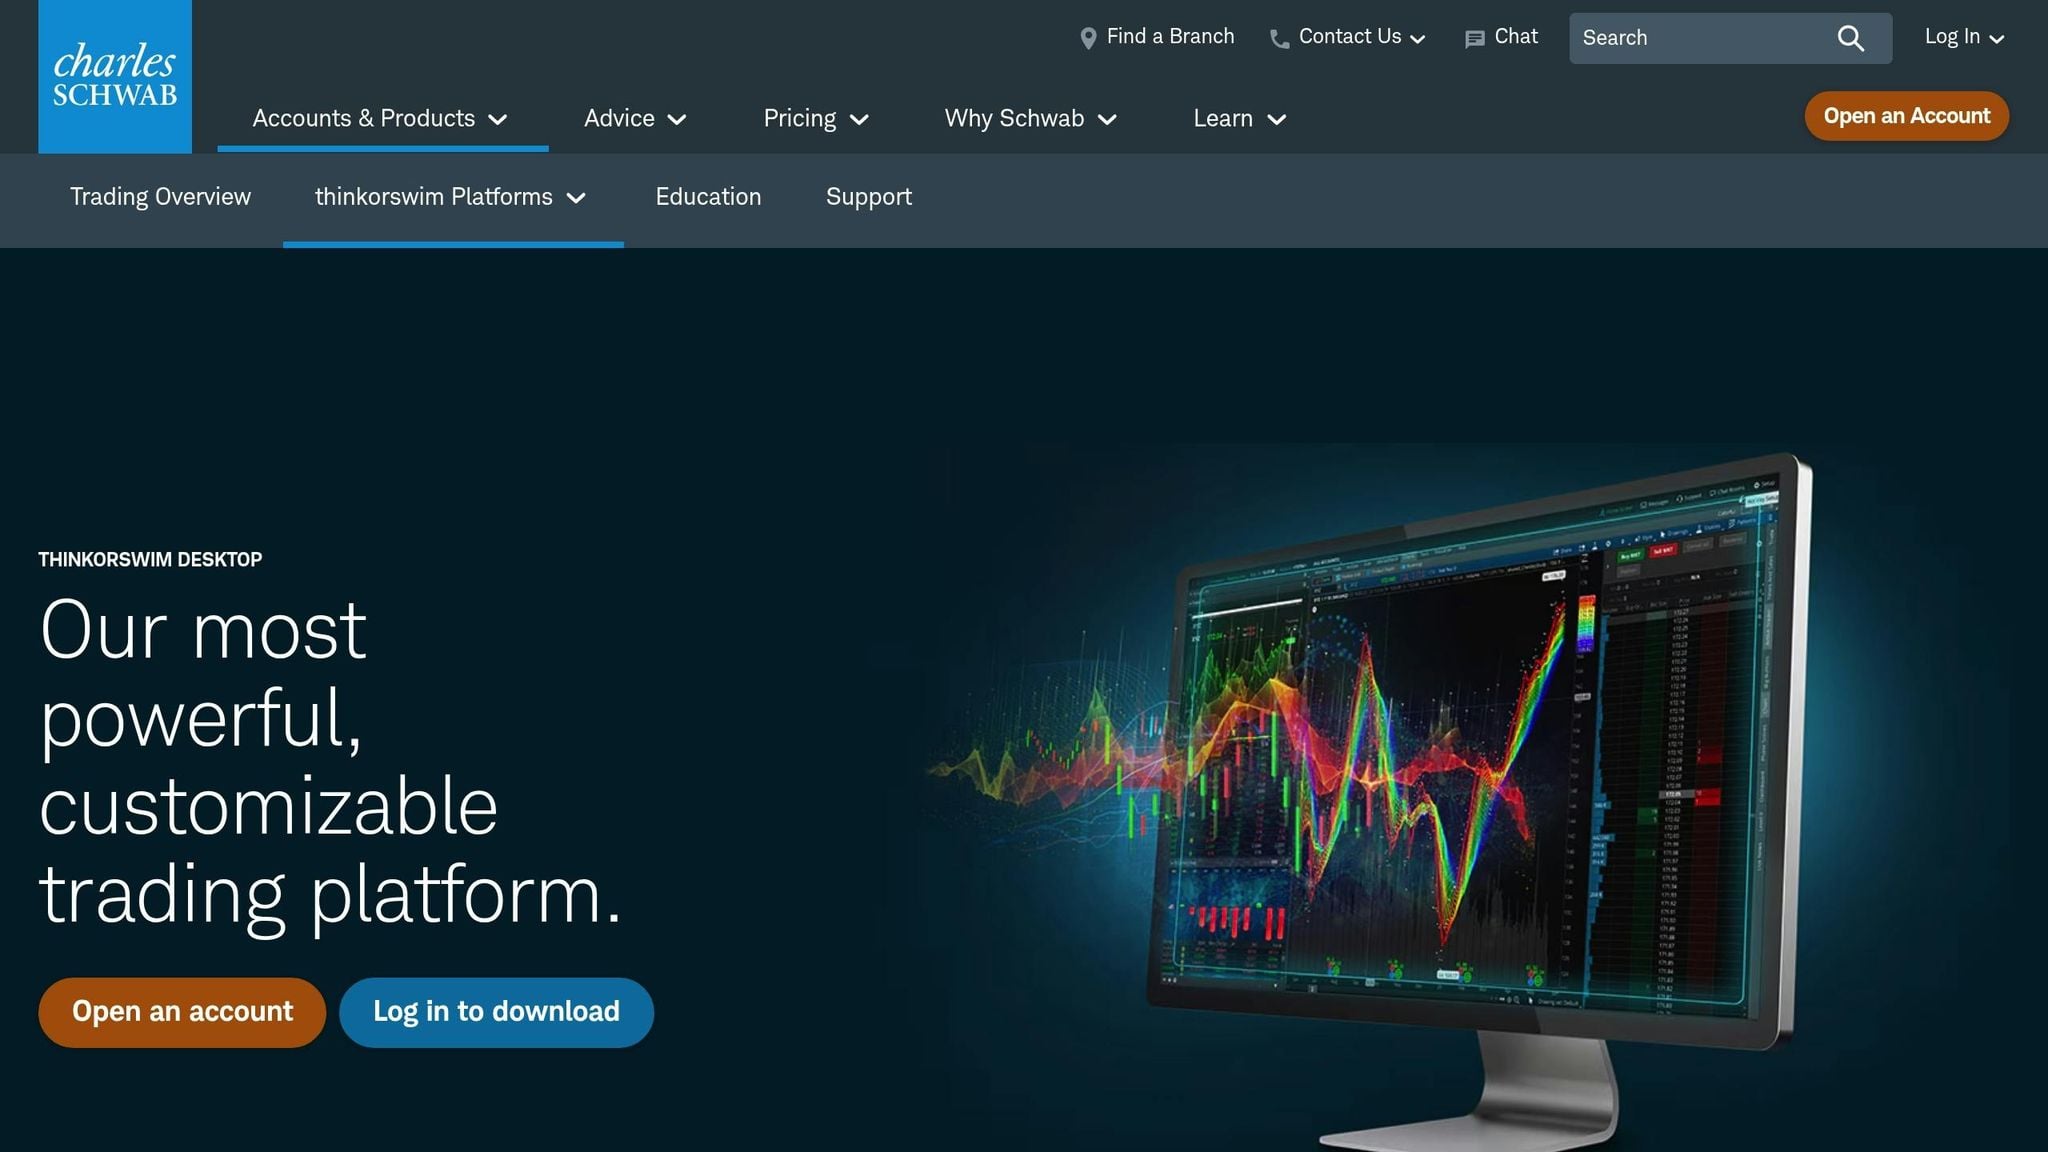
Thinkorswim, TD Ameritrade's flagship trading platform, is tailored for active U.S. stock and options traders who demand professional-grade tools. Best of all, it’s free for TD Ameritrade account holders, with $0 commissions on online U.S. stock and ETF trades.
Technical Analysis Tools
Thinkorswim offers a powerhouse suite of technical analysis tools, boasting over 400 technical studies and indicators. These include widely-used options like moving averages, RSI, MACD, and Bollinger Bands, as well as more advanced tools like Market Profile and Ichimoku. The platform also supports detailed pattern analysis with advanced drawing tools and multi-timeframe analysis, allowing up to 16 synchronized charts. Plus, traders can access decades of historical data to confirm trends and run backtests.
One standout feature is thinkScript, the platform’s scripting language. This tool allows users to create custom indicators, strategies, and scans. For instance, you can program scans to flag stocks that meet specific technical conditions - like EMA crossovers, RSI thresholds, or high relative volume - and set alerts for when those conditions are met. The platform also includes built-in pattern recognition, automatically identifying candlestick patterns, triangles, and head-and-shoulders formations. While these are rule-based rather than AI-driven, they add another layer of precision to your analysis. To top it off, Thinkorswim’s risk management tools seamlessly integrate with its analysis features, helping traders refine their decisions.
Risk Management Tools
Risk management is central to Thinkorswim’s design. The Analyze tab is particularly useful, enabling traders to simulate position sizing, calculate risk/reward ratios, and visualize potential drawdowns using probability cones for different scenarios. For those testing strategies, the paperMoney simulator allows experimentation with virtual capital, offering a risk-free way to refine techniques.
Options traders will appreciate the platform’s ability to display profit and loss scenarios across various expiration dates, helping optimize risk/reward setups. The Monitor tab keeps tabs on real-time portfolio performance, showing P&L, margin requirements, and exposure analysis. It even breaks down portfolio Greeks and sector concentrations to help traders avoid overexposure to specific risks.
The Strategy Tester adds another layer of sophistication by enabling backtesting with metrics like the Sharpe ratio, allowing traders to evaluate historical performance and fine-tune their strategies.
Real-Time Data Integration
Thinkorswim doesn’t just offer analysis - it ensures you stay connected to the market in real time. The platform provides streaming Level I and Level II data for U.S. stocks, options, futures, and forex at no additional cost for TD Ameritrade clients. Extended-hours trading is supported, with pre-market and after-hours data integrated seamlessly. Traders can also overlay economic data, news feeds, and corporate events directly onto charts, which is especially helpful for those reacting to earnings reports or macroeconomic updates outside regular trading hours.
For cryptocurrency enthusiasts, Thinkorswim includes Bitcoin and Ethereum futures contracts traded on the CME. However, it does not support direct spot crypto trading, making it less versatile than dedicated crypto exchanges.
| Pros | Cons | Target Audience |
|---|---|---|
| Over 400 indicators and advanced drawing tools; thinkScript for custom strategies; free for TD Ameritrade clients with $0 stock/ETF commissions; paperMoney simulator for risk-free testing; advanced options tools with portfolio Greeks | Complex interface with a steep learning curve; resource-heavy platform may lag on older devices; crypto limited to Bitcoin/Ethereum futures (no spot trading); primarily U.S.-focused | Active stock and options traders; day traders needing professional-grade tools; advanced technical analysts ready to tackle a learning curve; traders focused on U.S. equities, options, and futures |
4. Coinigy
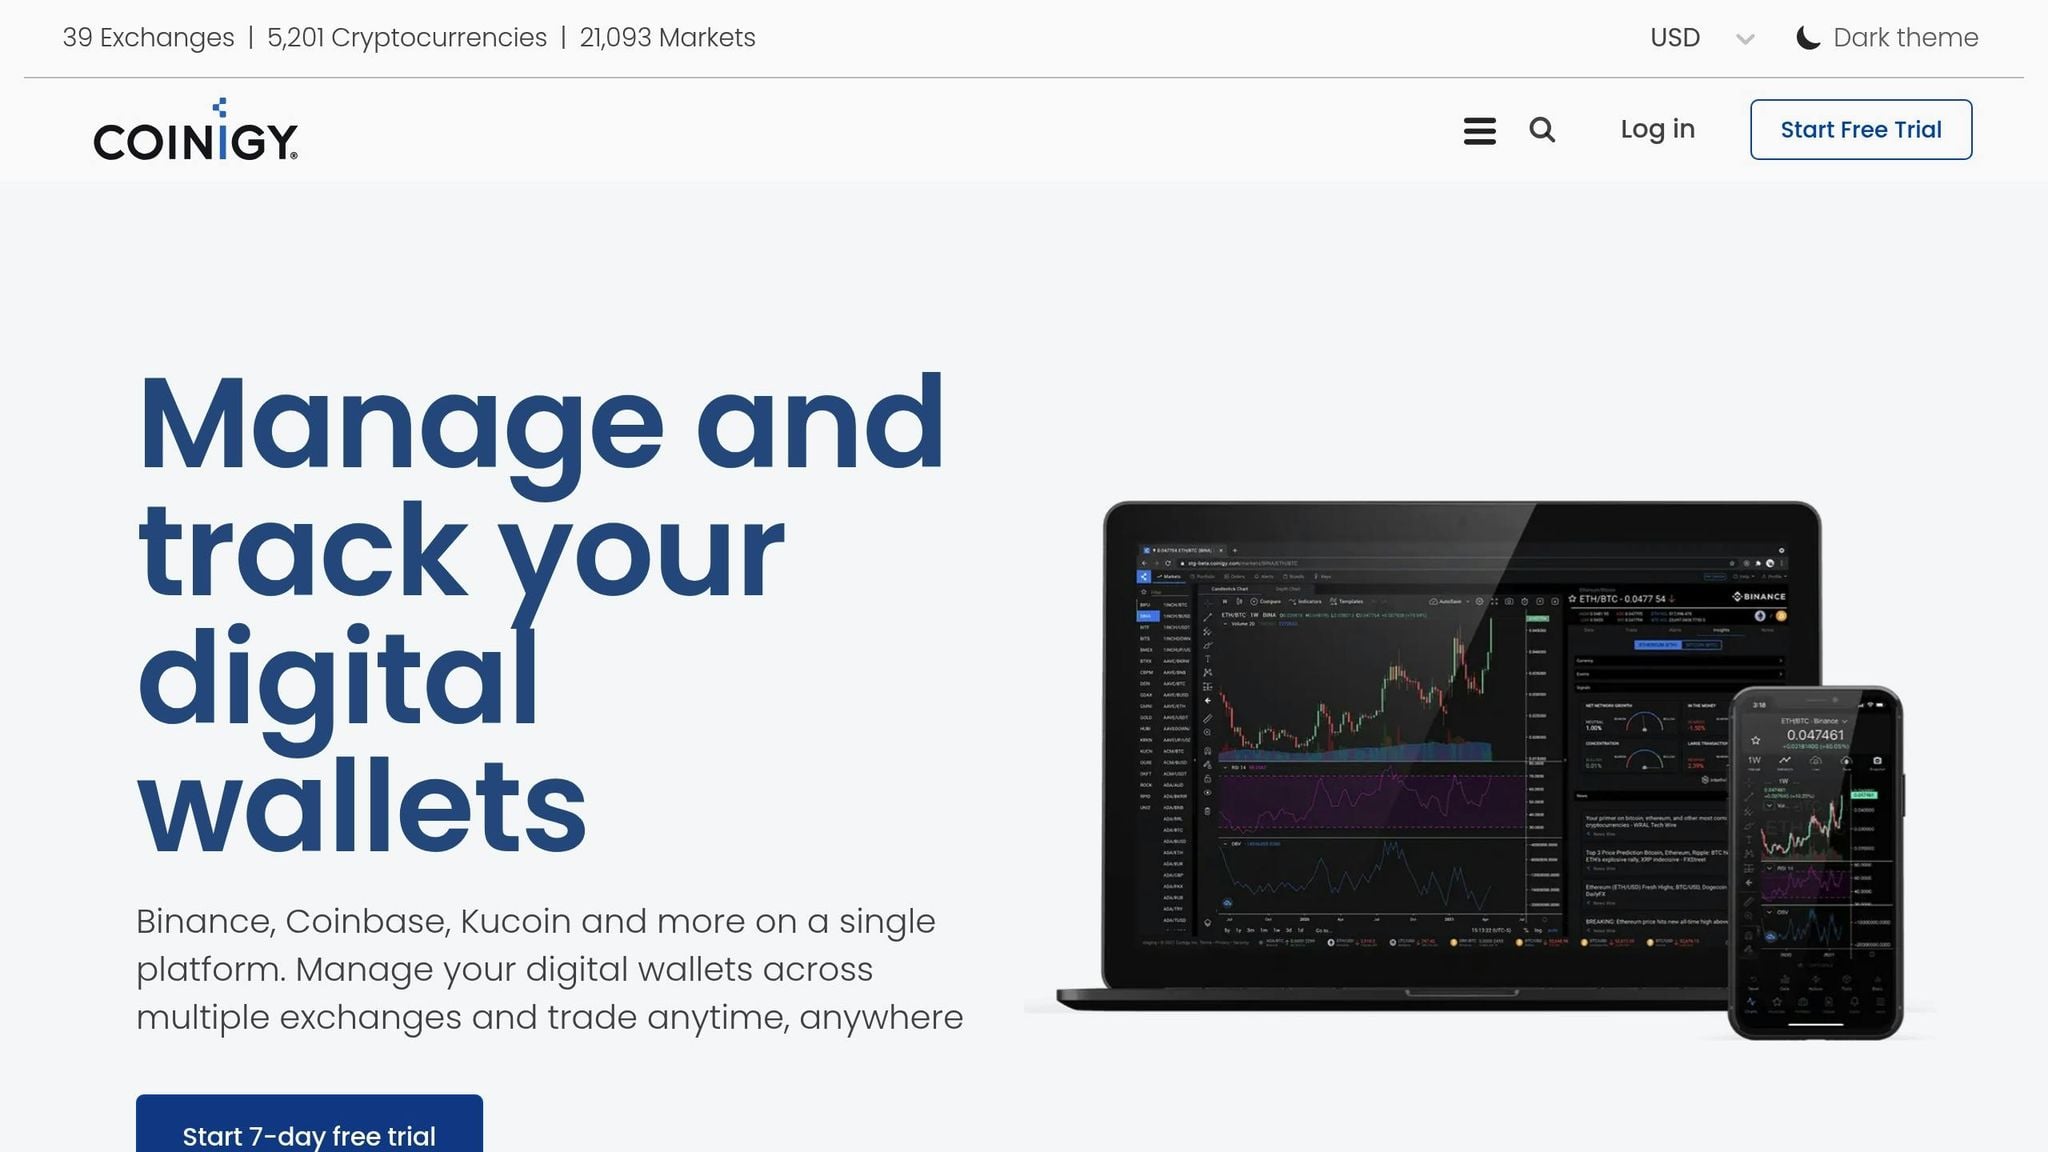
Coinigy is a trading and charting platform that connects to 46 cryptocurrency exchanges through direct data integration. It’s designed for active crypto traders who want the convenience of managing all their trades from a single dashboard. Pricing starts at $18.66 per month, with no free plan available[2]. Here’s a closer look at what makes Coinigy stand out.
Technical Analysis Tools
Coinigy provides 6 chart types, including candlestick charts, along with a variety of technical indicators and drawing tools. These tools help traders analyze trends, identify support and resistance levels, and compare data across multiple timeframes. The real-time charts can be customized using data from its integrated exchanges, and the user-friendly interface is particularly welcoming for those new to trading[2].
Risk Management and Portfolio Tracking
With portfolio tracking and account aggregation, Coinigy allows users to monitor holdings, balances, and open orders across all connected exchanges in one place. While it doesn’t offer specific tools like position sizing calculators or risk/reward analysis, the platform strengthens risk management with robust security measures, including AES 256-bit encryption, SSL, and two-factor authentication[2].
Real-Time Data Integration
Coinigy excels in providing real-time cryptocurrency data, covering over 5,000 cryptocurrencies across numerous exchanges. This extensive altcoin coverage is especially useful for traders exploring less-common trading pairs that aren’t available on broader multi-asset platforms. However, its focus is strictly on crypto markets - there’s no support for U.S. stocks or extended-hours stock trading[2].
| Pros | Cons | Target Audience |
|---|---|---|
| Integration with 46 crypto exchanges; portfolio tracking for 5,000+ cryptocurrencies; beginner-friendly interface; mobile app for trading on the go; strong security with AES 256-bit encryption and 2FA | No free plan (starts at $18.66/month); supports only crypto (no U.S. stocks); limited chart types (6) compared to some competitors; lacks AI-driven signals or pattern recognition | Crypto traders managing accounts across multiple exchanges; altcoin traders needing access to a wide range of cryptocurrencies; beginners looking for an intuitive platform; traders who prioritize portfolio tracking and integrated trading tools |
5. TrendSpider
TrendSpider is a platform designed to simplify technical analysis through automation. It supports U.S. stocks, ETFs, futures, forex, and cryptocurrencies, offering real-time or near real-time data based on your subscription. Pricing starts at $39–$44 per month for the Premium plan (billed annually), $79–$87 per month for the Elite plan, and professional-grade options begin at $149 per month[4]. Its standout feature is automation - it handles tasks like drawing trendlines, spotting patterns, and analyzing across multiple timeframes, saving traders significant manual work.
Technical Analysis Tools
TrendSpider delivers a powerful suite of tools for technical analysis. It includes over 200 built-in indicators like RSI, MACD, moving averages, and Bollinger Bands, along with advanced drawing tools such as automated trendlines, Fibonacci retracements, and heatmaps[4]. Features like Raindrop Charts and the multi-timeframe Matrix view allow traders to analyze daily and hourly trends simultaneously, making it easier to identify aligned signals across different timeframes[4].
AI Features and Trading Signals
The platform uses AI-driven pattern recognition to identify formations such as head and shoulders, triangles, wedges, and candlestick patterns automatically. Its Smart Checklists and Market Scanner generate Buy, Sell, and Hold alerts based on custom strategies, boasting backtesting accuracy of up to 80%[4]. While it doesn’t simplify decisions into one-word ratings, its scanning tools provide tailored trade ideas based on specific technical setups.
Risk Management Tools
TrendSpider includes tools to help traders manage risk effectively. Its calculators adjust trades across various timeframes, recommending trade sizes that align with account risk - typically 1–2% per trade. Users can plot entries, stop-losses, and profit targets directly on charts using its risk/reward ratio analyzers, offering clear visual insights into potential outcomes. Backtesting these tools has been shown to reduce drawdowns by as much as 30%[4]. Additionally, the integrated Trade Panel tracks open positions, stop-losses, and profit targets for both U.S. stocks and cryptocurrencies, making portfolio management more efficient.
Real-Time Data Integration
With real-time data from major U.S. exchanges like the NYSE and NASDAQ, as well as crypto feeds from platforms like Binance, Coinbase, and Bitfinex, TrendSpider covers over 10,000 assets. Updates occur in sub-seconds, ensuring traders have the latest information[4]. It also supports extended hours data for pre-market and after-hours trading, making it a valuable tool for day traders monitoring volatility in both traditional and crypto markets.
| Pros | Cons | Target Audience |
|---|---|---|
| Automated trendlines and pattern recognition save time; multi-timeframe analysis with Raindrop Charts; comprehensive backtesting and scanning tools; real-time data for stocks and crypto, including extended hours; built-in risk/reward visualizations | No free plan (starts at $39/month billed annually); complex interface with a learning curve; higher cost compared to some alternatives; not a full execution platform for all brokers | Intermediate to advanced traders focused on technical analysis; swing and day traders in U.S. stocks and cryptocurrencies; traders who value automation and backtesting over manual charting; active traders needing multi-timeframe and multi-asset capabilities |
6. MetaTrader 5
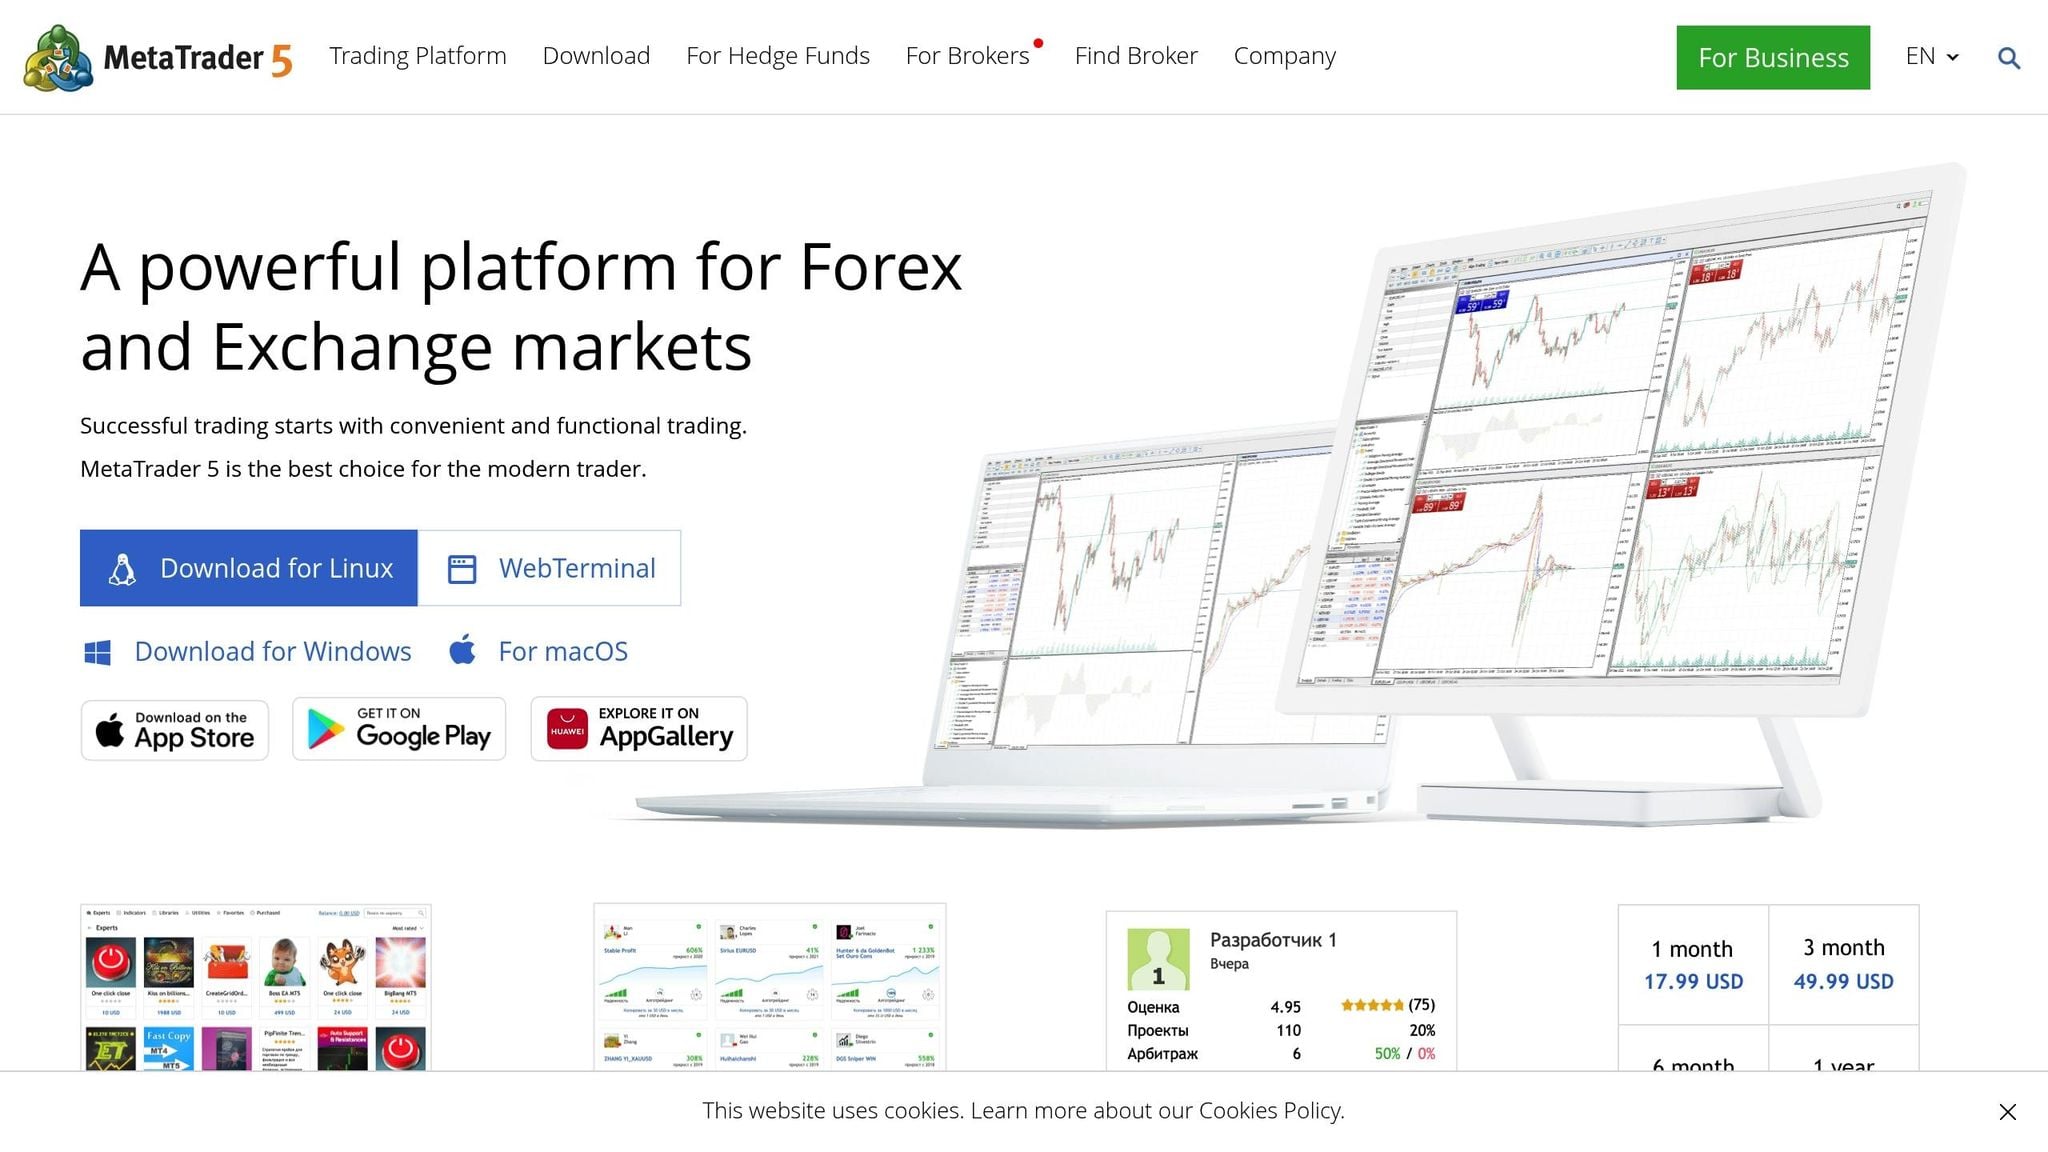
MetaTrader 5 is a powerful, free-to-download trading platform designed for multi-asset analysis. It supports U.S. stocks, cryptocurrencies, forex, and futures trading through a network of over 1,000 brokers. While the platform itself is free, costs vary depending on broker commissions and optional premium features.
Technical Analysis Tools
MetaTrader 5 comes packed with over 80 built-in indicators, including popular tools like Moving Averages, RSI, MACD, and Bollinger Bands. It also offers 38 analytical objects, such as trend lines, channels, Fibonacci retracements, and Gann tools, making it a comprehensive toolkit for assessing trends and momentum. The platform supports 21 timeframes, ranging from 1-minute to monthly charts, and allows users to display up to 100 charts simultaneously in multi-chart layouts.
AI Features and Trading Signals
While MetaTrader 5 doesn’t have built-in AI trading signals, it supports third-party integration of AI-powered Expert Advisors (EAs) available in the MQL5 marketplace. These EAs can automate pattern recognition for formations like candlestick patterns, head-and-shoulders, or triangles. However, traders looking to fully customize these tools will need some familiarity with MQL5 scripting.
Risk Management Tools
MetaTrader 5 includes essential risk management features like stop-loss, take-profit, and trailing stops. It also offers position sizing calculators, which help traders manage risk by determining optimal trade sizes. For instance, on a $10,000 account with a 2% risk per trade, the calculator adjusts the position size based on the stop-loss distance. The platform’s Trade tab enables real-time portfolio tracking, showing profit and loss metrics, margin levels, and equity curves. Additionally, traders can set up to 100 pending orders per account, allowing for precise entry and exit strategies.
Real-Time Data Integration
MetaTrader 5 delivers real-time, tick-by-tick data for U.S. stocks through CFDs on major exchanges like NYSE and NASDAQ. It also connects to over 1,000 cryptocurrencies via exchange plugins such as Binance and Bybit, offering 24/7 data feeds for crypto and forex markets. The Market Watch window provides low-latency updates and real-time depth-of-market data, making it ideal for high-frequency trading strategies. This level of precision and speed ensures MetaTrader 5 remains a reliable choice for traders.
| Pros | Cons | Target Audience |
|---|---|---|
| Extensive free indicators and drawing tools; supports multi-asset analysis for U.S. stocks, crypto, forex, and futures; customizable EAs for automation; robust backtesting with over 20 years of historical data; mobile apps with desktop-like functionality | Steep learning curve for MQL5 scripting; lacks native AI signals or pattern recognition; crypto integration depends on broker support; interface may feel outdated compared to newer platforms | Intermediate to advanced traders comfortable with technical tools; forex and crypto traders interested in automation; those prioritizing customization over simplicity; active traders needing multi-timeframe analysis across global markets |
7. CryptoCompare
CryptoCompare stands out as a platform designed for data aggregation and research, rather than active trading. This free, web-based tool provides access to a vast array of data on thousands of cryptocurrencies across major exchanges. From historical price trends to mining statistics and social metrics, it offers a treasure trove of information for those looking to understand the crypto market. Instead of focusing on advanced trading tools, CryptoCompare serves as a complement to trading platforms by emphasizing market data and historical insights.
Technical Analysis Tools
While the platform includes basic charting features, it’s not a hub for advanced technical analysis. Users can work with simple chart indicators and overlays across multiple timeframes. For example, you can layer 1-minute intraday charts with weekly views to identify trends or divergences - an approach well-suited for the 24/7 nature of cryptocurrency markets.
AI Features and Trading Signals
CryptoCompare does not provide native AI-driven signals or automated pattern recognition. If you're looking for algorithmic insights or predictive analytics, you'll need to pair this platform with other tools. Its primary focus remains on presenting data clearly and tracking market activity, rather than offering predictive or automated trading aids.
Risk Management Tools
The platform includes basic portfolio tracking features, allowing users to monitor their crypto holdings and market trends. However, it lacks more advanced risk management tools, such as position sizing calculators, automated stop-loss settings, or risk/reward ratio calculators. This makes CryptoCompare more of a research-oriented tool than one designed for executing or managing trades.
Real-Time Data Integration
CryptoCompare provides free, real-time data for thousands of cryptocurrencies, enabling users to keep tabs on the market around the clock. However, its scope is limited when it comes to U.S. stocks and extended-hours trading data. This focus on cryptocurrency research and market monitoring sets it apart from platforms geared toward real-time trade execution.
| Pros | Cons | Target Audience |
|---|---|---|
| Free access to real-time crypto data and basic charts; easy-to-use dashboard for tracking trends; comprehensive coverage of thousands of cryptocurrencies; includes historical price data, mining stats, and social metrics | No native AI signals or automated pattern recognition; limited technical analysis tools with fewer indicators; lacks advanced risk management features; no mobile app; not suitable for active trading | Beginner crypto traders interested in market research and portfolio tracking; investors who prioritize accessible and free cryptocurrency data; casual users monitoring trends without engaging in active trading |
Platform Comparison Table
The table below provides a side-by-side comparison of seven trading platforms, highlighting their key features, pricing, and ideal user groups.
| Platform | Key Features | Pricing (USD/mo) | Best For |
|---|---|---|---|
| StockioAI | AI-powered Buy/Sell/Hold signals, advanced pattern recognition, risk calculators, automated crypto and stock analysis, real-time market alerts, portfolio tracking | Free; $79.99/mo | Swing traders and crypto traders looking for AI-driven signals and risk tools for stocks and cryptocurrencies |
| TradingView | Over 100 indicators, 10+ chart types, 90+ drawing tools, community scripts, multi-asset coverage (stocks, crypto, forex), social trading features | Free; $12.95–$49.95/mo | Day traders and active traders needing advanced charting across multiple asset classes |
| Thinkorswim by TD Ameritrade | Pro-level workstation, advanced options analytics, paper trading, direct broker integration, real-time U.S. equities/options/futures data | Free (with TD Ameritrade account) | Day traders focused on U.S. stocks, options, and futures who need broker-integrated execution and professional tools |
| Coinigy | Integration with 45+ crypto exchanges, access to over 5,000 cryptocurrencies, portfolio tracking, order execution from one interface, AES-256 security | From $18.66/mo | Active crypto traders managing multiple exchange accounts who need centralized portfolio tracking and execution |
| TrendSpider | Automated trendline detection, pattern recognition, multi-factor alerts, backtesting, rule-based automation | From $149/mo | Swing and position traders focused on automated technical analysis and pattern detection |
| MetaTrader 5 | Multi-asset support via brokers, algorithmic trading (Expert Advisors), custom indicators, multi-timeframe analysis | Free (broker-dependent fees) | Forex and CFD day traders, as well as systematic traders who need algorithmic trading tools and broker flexibility |
| CryptoCompare | Real-time data for thousands of cryptocurrencies, historical price trends, mining statistics, social metrics, basic charting | Free (premium APIs vary) | Beginner crypto traders and researchers focused on market data and portfolio tracking rather than active trading |
For day traders, platforms like TradingView, Thinkorswim, Coinigy, and MetaTrader 5 offer real-time U.S. market data and broker integration, making them ideal for fast-paced trading. Swing traders can benefit from AI-driven insights and automated pattern detection available on StockioAI and TrendSpider, which help identify multi-day opportunities without constant monitoring. On the crypto side, Coinigy stands out with its integration of over 45 exchanges, while StockioAI provides automated analysis for major cryptocurrencies.
For those trading across multiple asset classes, TradingView supports over 740 cryptocurrencies across 30+ exchanges in addition to stocks, forex, and futures. However, its advanced features come with a subscription starting at $12.95 per month. On the other hand, CryptoCompare offers free access to extensive crypto data but lacks tools for executing trades. StockioAI, priced at $79.99 per month, delivers a strong combination of AI-powered signals and risk management features, making it a solid choice for traders prioritizing analytics and decision-making support.
Free options include TradingView, CryptoCompare, Thinkorswim (for TD Ameritrade users), and MetaTrader 5 (depending on broker fees). Ultimately, the best platform depends on your trading style and goals, whether you’re analyzing trends, managing risks, or executing trades in U.S. stock or crypto markets.
Conclusion
Choosing the right chart analysis platform depends on your trading style, the types of assets you trade, and whether you lean toward AI-driven tools or prefer a hands-on approach. Day traders often require platforms with real-time data integration and fast execution capabilities. On the other hand, swing traders benefit from features like automated pattern recognition and multi-day signal systems, which allow them to identify opportunities without needing to monitor the markets constantly. If you trade across multiple asset classes - stocks, forex, or cryptocurrencies - you’ll need a platform that offers comprehensive market coverage.
AI tools and risk management features have become game-changers in this space. Platforms equipped with AI-powered pattern recognition, automated trade signals, and built-in risk calculators can help reduce emotional decision-making and improve overall trading outcomes. For those who prefer systematic analysis, advanced tools that process dozens of data points per second and suggest stop-loss levels with optimal position sizes can make a huge difference in maintaining discipline and managing risk effectively.
Pricing is another key consideration, with options ranging from free plans like TradingView’s basic tier and CryptoCompare to premium subscriptions costing between $12.95 and $149.00 per month. While free plans are great for beginners exploring the basics, active traders usually need paid plans to unlock features like real-time data, advanced alerts, and customizable chart layouts.
To find the best platform for your needs, start by aligning the features with your workflow. If you trade both stocks and crypto, look for platforms offering unified support for multiple asset classes. Take advantage of free trials to test how efficiently you can set up alerts, execute trades, and use risk management tools. Crypto traders should also verify exchange integrations and robust security measures like AES-256 encryption, while stock traders should confirm access to U.S. market data and options analytics. The comparison table above outlines pricing, features, and user profiles to help you narrow down your choices based on budget and trading habits.
FAQs
What key features should I look for in a chart analysis platform?
When selecting a chart analysis platform, prioritize features that can improve your trading decisions. Start with interactive charts that include advanced technical indicators to help you analyze market trends. Platforms offering AI-powered insights, such as buy/sell signals and trend forecasts, can give you an extra edge. Don’t overlook risk management tools like position sizing calculators and stop-loss features - they’re crucial for protecting your investments. Additionally, access to real-time market data and tools for spotting patterns, like support and resistance levels, can help you identify opportunities and manage risks more effectively.
How does AI improve trading strategies on StockioAI?
AI takes trading strategies on StockioAI to the next level by using advanced machine learning to dive deep into market trends, spot patterns, and pinpoint critical opportunities like trend reversals or the best times to enter and exit trades.
With real-time trading signals, support and resistance levels, and in-depth technical indicators, it equips traders with the tools they need to make faster, smarter decisions with greater precision and assurance.
What should traders consider when budgeting for advanced chart analysis tools?
When planning your budget for advanced chart analysis tools like StockioAI, it's important to account for subscription fees. These typically range from free basic plans to premium options priced between $50 and $100 per month. Premium subscriptions often provide access to features like real-time data, AI-driven insights, and risk management tools.
You might also encounter extra costs for optional add-ons or advanced analytics. To get the most out of your investment, evaluate your trading habits - how often you trade and the level of analysis you need. This way, you can choose a plan that meets your requirements without stretching your budget too thin.